
1. Introduction to Energy and Power
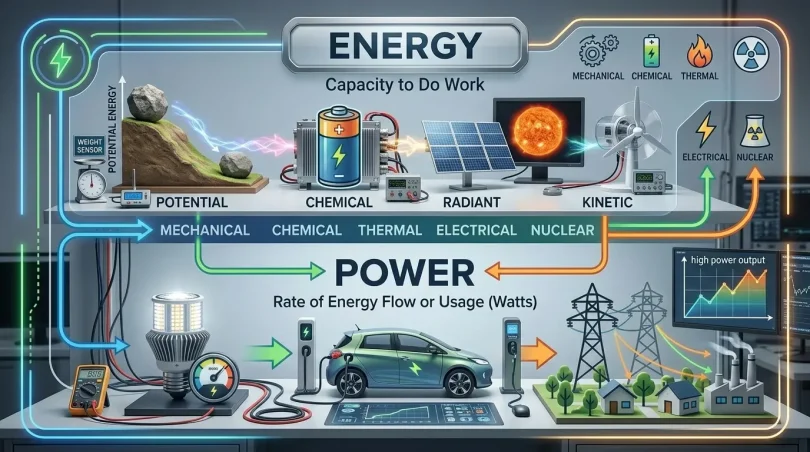
Energy is the capacity to do work or produce change, while power is the rate at which energy is generated, transferred, or consumed. Together, energy and power are the foundation of modern life, supplying electricity to homes, businesses, transportation, industries, and cities.
Energy exists in many forms, including electricity, heat, light, chemical energy, and mechanical energy. Power determines how quickly that energy is produced or used. Understanding the difference between energy and power is essential for understanding electricity generation, renewable energy, energy storage, fuel consumption, and the global energy system.
As global energy demand continues to grow, the energy and power sector is undergoing major changes driven by renewable energy, electrification, energy storage, and efforts to reduce greenhouse gas emissions. This guide explains the fundamentals of energy and power, how electricity is generated and distributed, major energy sources, global energy trends, and the technologies shaping the future of the energy industry.
Key facts at a glance:
- Global electricity demand continues to increase as economies become more electrified.
- Renewable energy is playing a growing role in global electricity generation.
- Solar and wind power costs have fallen significantly over the past decade.
- Hundreds of millions of people still lack reliable access to electricity.
- Energy storage is becoming increasingly important for integrating renewable power into electricity grids.
2. What Is Energy?
Energy is a physical quantity representing a system’s capacity to perform work or cause change. The word comes from the Greek “energeia,” meaning activity or operation. In physics, energy is formally defined as the ability of a system to do work, where work is the application of force over a distance.
One of the most important principles in all of physics is that energy cannot be created or destroyed. It can only be converted from one form to another. This is the Law of Conservation of Energy, which we cover in detail in Section 7.
Why Energy Matters Beyond Physics
Energy is not just a concept in textbooks. It is the single most important input to economic production. The World Bank has consistently found that access to reliable, affordable energy is one of the strongest predictors of a country’s economic development. Nations with secure, diverse energy supplies tend to have higher living standards, better healthcare systems, and more stable economies.
Consider these real-world connections:
Economic productivity: Every major industry, from steel manufacturing to software development, requires energy. The U.S. Energy Information Administration (EIA) reports that the industrial sector alone accounts for about 32% of total U.S. energy consumption.
Healthcare: Hospitals require uninterrupted power for life-support systems, refrigerated medications, and diagnostic equipment. Power outages in healthcare settings can be life-threatening.
Food security: Modern agriculture depends on energy for irrigation pumps, mechanized harvesting, food refrigeration, and the production of nitrogen fertilizers (which are made using natural gas).
Digital infrastructure: Data centers that run the internet consume enormous amounts of energy. Global data centers consumed approximately 200-250 terawatt-hours (TWh) of electricity in 2022, a figure that is growing rapidly with artificial intelligence workloads (IEA, 2023).
3. What Is Power?
Power is the rate at which energy is transferred, converted, or consumed per unit of time. The standard unit of power is the watt (W), named after Scottish inventor James Watt.
The fundamental relationship is: P = E / t
Where P is power in watts, E is energy in joules, and t is time in seconds.
One watt equals one joule of energy transferred per second. To understand the difference intuitively: a 100-watt light bulb consuming power for one hour uses 100 watt-hours (or 0.1 kilowatt-hours) of energy. The wattage tells you how fast it uses energy; the watt-hours tell you how much total energy was used.
Types of Power
Mechanical Power is the rate at which physical work is done by engines and machinery. A car engine rated at 150 horsepower (approximately 112 kilowatts) can do mechanical work at that rate under full load.
Electrical Power is the rate of electrical energy transfer in a circuit. In direct current (DC) systems, it equals voltage multiplied by current (P = V x I). In alternating current (AC) systems, it is more complex because of power factor.
Thermal Power refers to the rate of heat transfer. Power plants are often described in terms of their thermal output before conversion to electricity.
Hydraulic Power describes the rate of energy transfer through fluid pressure and flow, relevant in industrial hydraulic systems and hydroelectric generation.
Radiant Power is the rate at which electromagnetic energy (light, radio waves, infrared) is emitted or received.
Power Formulas
The key power formulas used in electrical engineering are:
- P = E / t (Power = Energy divided by Time)
- P = V x I (Power = Voltage multiplied by Current)
- P = I squared x R (Power = Current squared multiplied by Resistance)
- P = V squared / R (Power = Voltage squared divided by Resistance)
- For AC circuits: P = V x I x cos(theta), where cos(theta) is the power factor
4. Energy vs Power: Key Differences
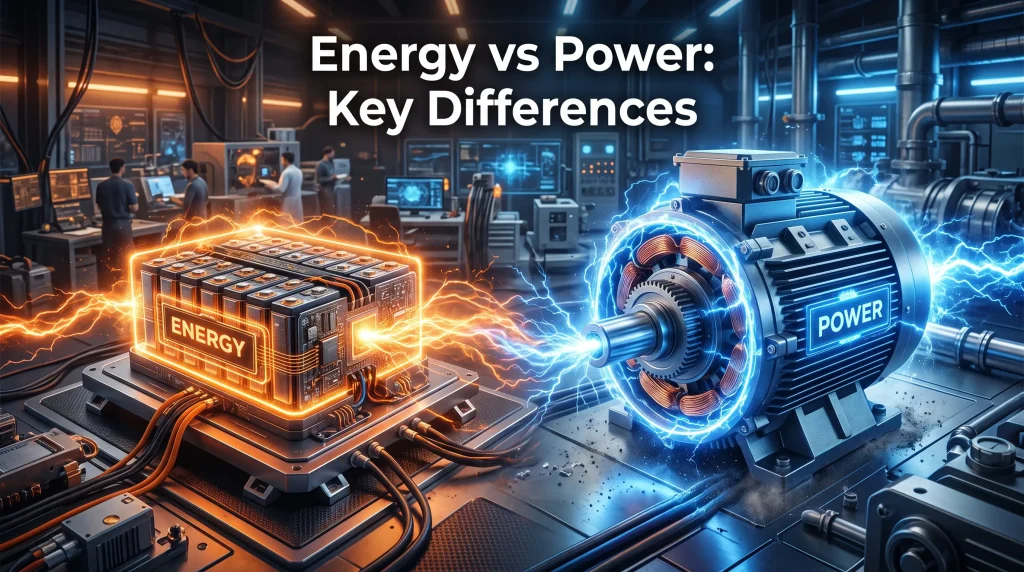
The distinction between energy and power is one of the most common points of confusion in both everyday conversation and technical discussions. Here is a clear breakdown:
| Aspect | Energy | Power |
|---|---|---|
| Definition | Total capacity to do work | Rate at which work is done |
| SI Unit | Joule (J) | Watt (W) |
| Common Units | kWh, BTU, Calorie, MJ | kW, MW, GW, Horsepower |
| Formula | E = P x t | P = E / t |
| Analogy | Total water in a tank | Rate at which water flows out |
| Example | 10 kWh stored in a battery | 2 kW being drawn from the battery |
| What it measures | Quantity | Rate |
| Can it run out? | Yes | No (it is a rate, not a stock) |
A practical example: When you receive an electricity bill, you pay for energy consumed in kilowatt-hours (kWh), not for the power rating of your appliances. A 2,000-watt (2 kW) electric heater running for 5 hours uses 10 kWh of energy. The heater always has a power rating of 2 kW, but the energy it consumes depends on how long it runs.
Another example from the power grid: A solar farm might have an installed capacity (power) of 500 megawatts (MW), but its actual annual energy production depends on how many hours per year it generates at or near that peak. A capacity factor of 20% means it produces 500 MW x 8,760 hours x 0.20 = approximately 876,000 MWh (876 GWh) of energy per year.
5. Forms of Energy
Energy exists in multiple interconvertible forms. Every energy system in the modern world involves converting energy from one form to another. Understanding these forms is foundational to understanding how power generation, storage, and consumption work.
Kinetic Energy
Kinetic energy is the energy of motion. Any object in motion possesses kinetic energy. The formula is KE = 0.5 x m x v squared, where m is mass and v is velocity.
In the energy sector, kinetic energy is central to wind turbines (moving air), hydroelectric turbines (moving water), and the rotating shafts of generators. A wind turbine converts the kinetic energy of moving air into mechanical rotation, which is then converted into electricity.
Potential Energy
Potential energy is stored energy based on position or condition. Gravitational potential energy (PE = mgh, where g is gravitational acceleration and h is height) is used in hydroelectric dams, where water stored at elevation has potential energy that is released when it flows downhill through turbines.
Pumped hydro storage, the world’s largest form of energy storage (accounting for over 90% of global grid storage capacity according to IRENA), works entirely on this principle.
Thermal Energy (Heat Energy)
Thermal energy is energy related to the temperature of matter. All matter above absolute zero temperature contains thermal energy. In power generation, thermal energy is central to coal, natural gas, and nuclear power plants, which convert thermal energy into mechanical energy (via turbines) and then into electrical energy.
Thermal energy storage systems are increasingly used in concentrated solar power (CSP) plants using molten salt, which can store heat at temperatures above 500 degrees Celsius.
Chemical Energy
Chemical energy is stored in the bonds between atoms in molecules. When these bonds break and reform in chemical reactions (combustion, electrochemical reactions), energy is released or absorbed.
Fossil fuels store enormous amounts of chemical energy formed over millions of years. Gasoline contains approximately 44 megajoules per kilogram (MJ/kg) of chemical energy. Lithium-ion batteries store chemical energy electrochemically, typically at 150 to 300 Wh/kg for current technology.
Electrical Energy
Electrical energy is produced by the movement of electric charge (electrons) through a conductor. It is the most versatile form of energy because it can be transmitted over long distances, converted into almost any other form of energy efficiently, and controlled precisely with electronics.
Global electricity generation reached approximately 28,000 TWh in 2022 (IEA), with roughly 30% coming from renewable sources.
Nuclear Energy
Nuclear energy is released from the nuclei of atoms through fission (splitting heavy atoms like uranium-235 or plutonium-239) or fusion (combining light atoms like hydrogen isotopes). Nuclear fission releases approximately 2 million times more energy per kilogram of fuel than the combustion of coal.
As of 2024, there are 413 operational nuclear reactors in 31 countries worldwide, generating about 10% of global electricity (World Nuclear Association).
Radiant Energy (Electromagnetic Energy)
Radiant energy is carried by electromagnetic waves, including visible light, infrared radiation, ultraviolet light, radio waves, and X-rays. The sun emits radiant energy that travels 150 million kilometers to reach Earth.
Solar photovoltaic (PV) cells convert radiant energy directly into electrical energy through the photovoltaic effect. The amount of solar energy that reaches Earth’s surface in one hour is theoretically enough to power the entire world economy for one year (though practical harnessing is a far different matter).
Mechanical Energy
Mechanical energy is the sum of kinetic and potential energy in a moving system. In a falling object, mechanical energy continuously converts between potential and kinetic as it falls. In a power plant turbine, mechanical energy is the intermediate step between the primary energy source and electrical energy generation.
Elastic Energy
Elastic energy is stored in materials that have been deformed, such as compressed springs or stretched rubber. While not a major source in large-scale power generation, elastic energy principles are relevant in mechanical energy storage systems and certain industrial applications.
6. Units of Energy and Power
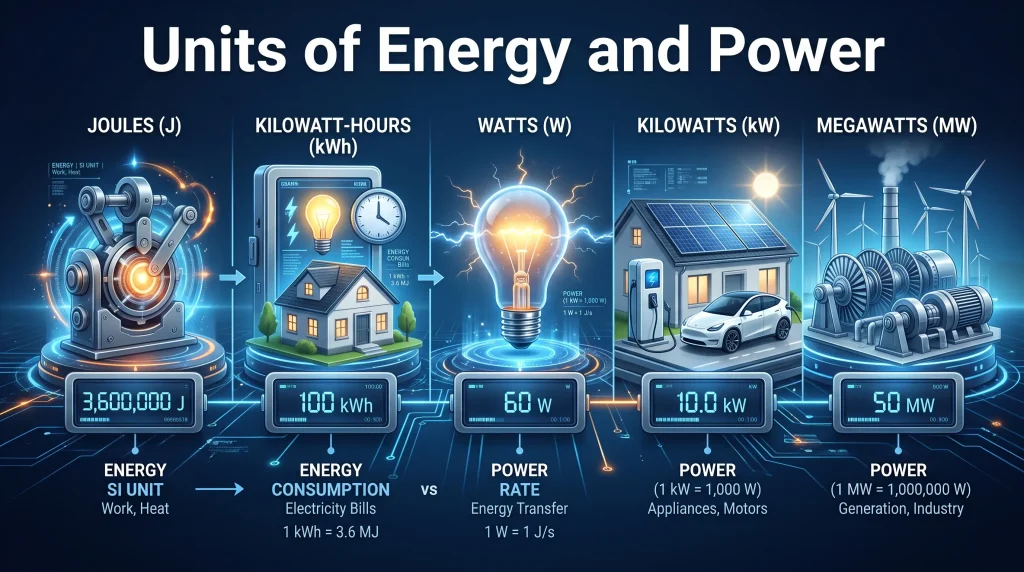
Understanding the units used to measure energy and power is essential for reading technical specifications, utility bills, and policy documents.
Energy Units
| Unit | Symbol | Equivalent | Common Use |
|---|---|---|---|
| Joule | J | SI base unit | Scientific calculations |
| Kilowatt-hour | kWh | 3,600,000 J | Electricity billing |
| Megawatt-hour | MWh | 1,000 kWh | Large power plants |
| Gigawatt-hour | GWh | 1,000 MWh | National energy statistics |
| Terawatt-hour | TWh | 1,000 GWh | Country energy totals |
| Calorie | cal | 4.184 J | Nutrition, chemistry |
| Kilocalorie | kcal | 4,184 J | Food energy labels |
| BTU | BTU | 1,055 J | Heating and cooling systems |
| Therm | therm | 100,000 BTU | Natural gas billing |
| Barrel of Oil Equivalent | BOE | 6.117 GJ | Comparing energy sources |
| Ton of Oil Equivalent | TOE | 41.868 GJ | International energy reports |
| Megajoule | MJ | 1,000,000 J | Industrial energy use |
| Gigajoule | GJ | 1,000 MJ | National statistics |
| Exajoule | EJ | 10^18 J | Global energy totals |
Power Units
| Unit | Symbol | Equivalent | Common Use |
|---|---|---|---|
| Watt | W | 1 J/s | Appliances, electronics |
| Kilowatt | kW | 1,000 W | Home systems, small generators |
| Megawatt | MW | 1,000 kW | Power plants, wind farms |
| Gigawatt | GW | 1,000 MW | National grid capacity |
| Terawatt | TW | 1,000 GW | Global energy statistics |
| Horsepower | hp | 746 W | Engines, motors |
| BTU per hour | BTU/hr | 0.293 W | HVAC systems |
Conversion tip: To convert kW to horsepower, multiply by 1.341. A 100 kW electric motor is equivalent to 134.1 horsepower.
7. The Law of Conservation of Energy
The Law of Conservation of Energy states that the total energy of an isolated system remains constant. Energy can neither be created nor destroyed; it can only be converted from one form to another or transferred from one object to another.
This is the First Law of Thermodynamics, one of the most fundamental laws of physics. It was formally stated in the mid-19th century through the work of scientists including James Joule, Rudolf Clausius, and Hermann von Helmholtz.
What This Means in Practice
When you burn coal in a power plant, the chemical energy stored in coal converts to thermal energy (heat), which converts to mechanical energy (steam pressure rotating a turbine), which converts to electrical energy (generator output). At each stage, some energy is “lost” as unusable heat due to the Second Law of Thermodynamics, but the total amount of energy in the system remains constant.
This is why no machine can be 100% efficient. Every real energy conversion process produces some waste heat. The efficiency of a typical coal power plant is about 33 to 40%, meaning 60 to 67% of the chemical energy in the coal is released as waste heat rather than converted to electricity.
The Second Law of Thermodynamics
The Second Law states that the total entropy (disorder) of an isolated system always increases over time. In practical terms, this means energy tends to spread out and become less useful. High-grade energy (like electricity) can do useful work; low-grade energy (like diffuse heat at ambient temperature) cannot.
This law sets the fundamental limits on efficiency for all heat engines, including gas turbines, steam turbines, and internal combustion engines. The maximum theoretical efficiency of a heat engine (the Carnot efficiency) depends on the temperature difference between the hot and cold reservoirs.
Carnot efficiency = 1 – (Tc / Th), where Tc is the cold reservoir temperature and Th is the hot reservoir temperature (both in Kelvin).
8. Energy Transformation
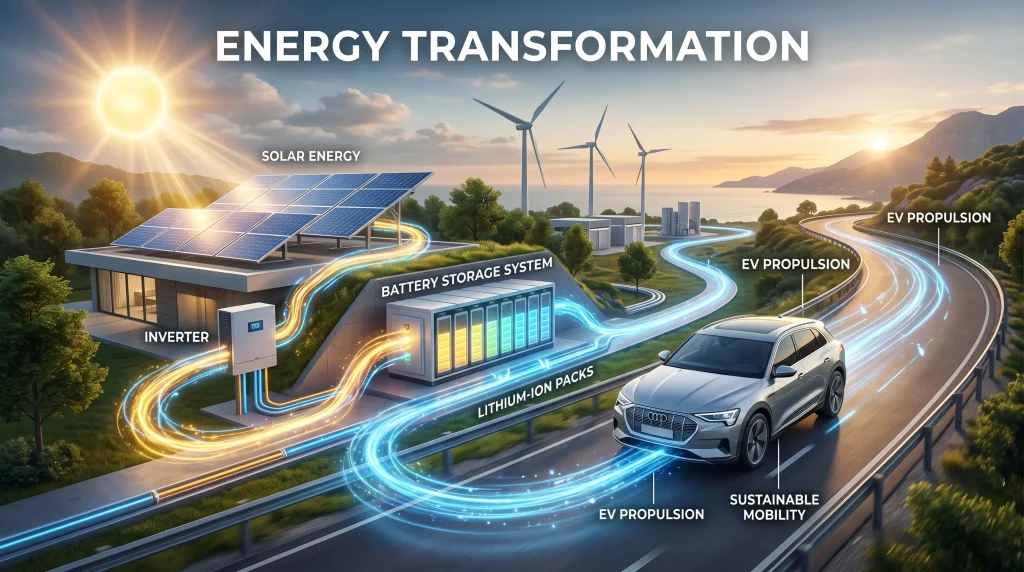
Energy transformation is the process of converting energy from one form into another. Every power generation system in the world is essentially a chain of energy transformations.
Common Energy Transformation Chains
Coal Power Plant: Chemical energy (coal) -> Thermal energy (combustion heat) -> Mechanical energy (steam turbine rotation) -> Electrical energy (generator) -> Thermal energy (waste heat, transmission losses)
Solar PV System: Radiant energy (sunlight) -> Electrical energy (photovoltaic effect) -> Electrical energy (inverter output, AC power)
Wind Turbine: Kinetic energy (wind) -> Mechanical energy (blade and shaft rotation) -> Electrical energy (generator)
Hydroelectric Plant: Gravitational potential energy (elevated water) -> Kinetic energy (falling water) -> Mechanical energy (turbine rotation) -> Electrical energy (generator)
Lithium-Ion Battery (charging): Electrical energy -> Chemical energy (electrochemical storage)
Lithium-Ion Battery (discharging): Chemical energy -> Electrical energy
Efficiency of Transformations
No energy transformation is 100% efficient. Every real-world conversion loses some energy as waste heat. Here are typical efficiency figures for common energy systems:
| System | Typical Efficiency |
|---|---|
| Combined cycle gas turbine power plant | 55 to 62% |
| Coal-fired power plant | 33 to 45% |
| Nuclear power plant | 33 to 37% |
| Hydroelectric plant | 85 to 95% |
| Solar PV panel (commercial) | 15 to 22% |
| Concentrated Solar Power (CSP) | 15 to 20% |
| Wind turbine | 35 to 45% (of wind energy) |
| Lithium-ion battery (round-trip) | 85 to 95% |
| LED light bulb | 30 to 50% (of electrical energy to visible light) |
| Fuel cell (hydrogen) | 50 to 60% |
| Internal combustion engine | 20 to 35% |
| Electric motor | 85 to 97% |
The Sankey diagram is a standard tool used by engineers to visualize energy flows and losses through a system. Every major energy report from organizations like the IEA and EIA includes Sankey diagrams showing where energy is consumed and where it is lost.
9. The Global Energy Landscape
Global Energy Mix
The global energy mix describes the combination of different energy sources used to meet worldwide primary energy demand. As of 2023, the breakdown according to the IEA’s World Energy Outlook is approximately:
| Energy Source | Share of Global Primary Energy |
|---|---|
| Oil | 31% |
| Coal | 27% |
| Natural Gas | 23% |
| Modern Renewables (solar, wind, hydro, bioenergy) | 14% |
| Nuclear | 5% |
Fossil fuels collectively supply approximately 81% of global primary energy, a figure that has only slowly declined over the past two decades despite massive renewable energy investment. This highlights the scale of the challenge in the global energy transition.
However, in electricity generation specifically, the renewable share is growing much faster. In 2023, renewables accounted for 30% of global electricity generation, with hydropower contributing the largest share among renewables, followed by wind and solar.
Global Energy Consumption Trends
According to the IEA, total global primary energy demand increased from approximately 550 EJ in 2010 to 620 EJ in 2023, driven by:
- Population growth (world population passed 8 billion in 2022)
- Rapid industrialization in emerging economies, particularly China and India
- Expanding middle-class populations and rising living standards
- Growth in digital infrastructure and data centers
- Increasing adoption of electric vehicles and electric heating
China is now the world’s largest energy consumer, accounting for approximately 26% of global primary energy demand in 2023 (IEA). The United States is second at approximately 15%.
Importantly, energy intensity (energy consumed per unit of GDP) has been declining in most advanced economies due to efficiency improvements and the shift toward service industries. Global energy intensity fell by approximately 1.6% per year between 2010 and 2022 (IEA).
Energy Security
Energy security refers to the uninterrupted availability of energy sources at an affordable price. It has four key dimensions, as defined by the IEA:
Availability: Sufficient physical supplies of energy to meet demand
Accessibility: Ability to reach energy markets (pipelines, shipping routes, grid connections)
Affordability: Energy priced within acceptable ranges for consumers and industry
Acceptability: Energy that meets environmental and social standards
The 2022 global energy crisis, triggered largely by Russia’s invasion of Ukraine and the resulting disruption to natural gas supplies to Europe, demonstrated how quickly energy security can be threatened. European wholesale natural gas prices rose by over 400% during 2021 to 2022, causing widespread economic disruption.
Countries improve energy security by diversifying their energy mix, building strategic reserves, developing domestic renewable resources, and expanding grid interconnections with neighboring countries.
History of Human Energy Use
Human energy use has evolved through distinct technological epochs:
The Biomass Era (before 1800): Wood and charcoal were the primary energy sources. Human and animal muscle provided mechanical power.
The Steam and Coal Era (1800 to 1900): The Industrial Revolution drove rapid expansion of coal use. The steam engine transformed manufacturing, mining, and transportation.
The Oil and Electricity Era (1900 to 1970): Petroleum became the dominant fuel for transportation. Electrification spread through homes and industry.
The Natural Gas Expansion (1970 to present): Natural gas grew as a cleaner alternative to coal for power generation and heating.
The Renewable Era (2010 to present): Rapidly falling costs for solar and wind are driving the fastest energy transition in history. In 2023, solar and wind together accounted for over 90% of new electricity capacity additions worldwide (IRENA).
10. Regional Energy Profiles
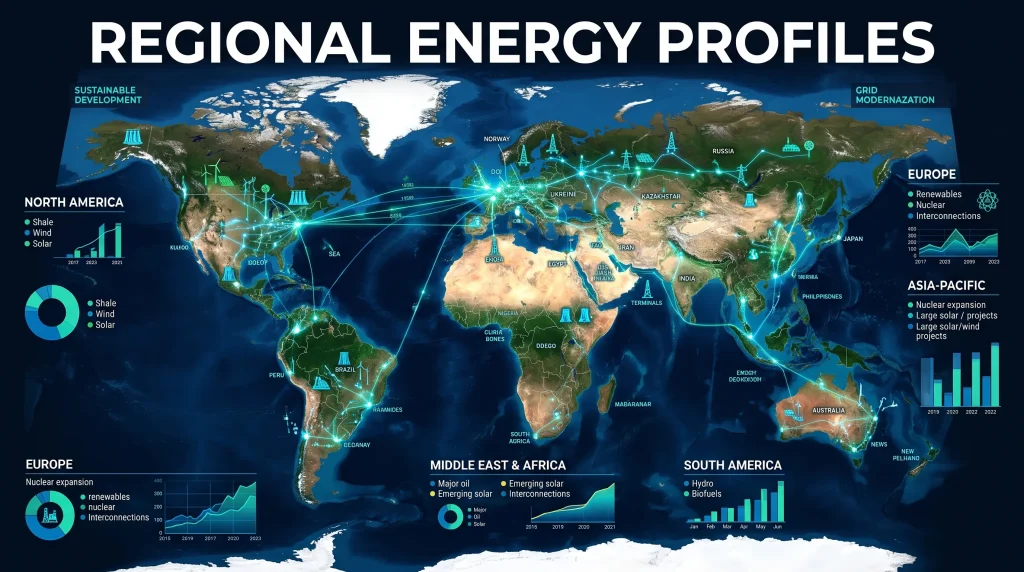
United States
The United States is the world’s second-largest energy consumer and has the most diversified energy mix of any major economy.
Electricity generation mix (2023, EIA):
- Natural Gas: 43%
- Renewables (all types): 22%
- Nuclear: 19%
- Coal: 16%
The U.S. became the world’s largest oil and natural gas producer following the shale revolution of the 2010s, driven by horizontal drilling and hydraulic fracturing (fracking). This transformed the U.S. from a major energy importer to a net energy exporter.
Renewable energy is growing rapidly, particularly wind power in Texas and the Midwest, and solar in California, Texas, and the Southwest. The Inflation Reduction Act (2022) committed over $370 billion in climate and clean energy investment, representing the largest clean energy policy action in U.S. history.
European Union
The EU has the world’s most ambitious climate and energy policies, driven by binding targets under the European Green Deal and the Fit for 55 legislative package.
Key targets:
- 42.5% of energy from renewables by 2030 (up from 23% in 2022)
- 55% reduction in greenhouse gas emissions by 2030 (vs. 1990 levels)
- Climate neutrality by 2050
The EU is the global leader in offshore wind energy, with the North Sea hosting major offshore wind development by the UK, Germany, the Netherlands, and Denmark. The bloc has also been rapidly installing solar, which reached over 200 GW of total installed capacity by 2023 (Solar Power Europe).
The REPowerEU plan, launched in response to the Ukraine war energy crisis, accelerated the EU’s efforts to reduce dependence on Russian natural gas and fast-track renewable energy deployment.
China
China is simultaneously the world’s largest energy consumer, the largest carbon emitter, and the largest installer of renewable energy.
Key statistics (2023):
- Total electricity generation: approximately 9,000 TWh (IEA)
- Coal’s share of electricity: approximately 60%
- New renewable capacity added in 2023: over 290 GW (more than the rest of the world combined)
- Total solar capacity: over 600 GW
- Total wind capacity: over 400 GW
China manufactures approximately 80% of the world’s solar panels and controls the majority of global lithium-ion battery production. Despite its massive renewable energy build-out, China’s total coal consumption continues to grow in absolute terms due to the enormous scale of its economic growth.
China has announced a target to peak carbon emissions before 2030 and achieve carbon neutrality by 2060.
India
India is the world’s third-largest energy consumer and is experiencing some of the fastest energy demand growth of any major economy.
Key statistics (2023):
- Population: 1.4 billion, with significant rural electrification remaining incomplete
- Coal’s share of electricity: approximately 73%
- Installed renewable capacity: over 180 GW (Solar Energy Corporation of India)
- Target: 500 GW of non-fossil electricity capacity by 2030
India has announced ambitious renewable energy targets, driven partly by domestic climate commitments and partly by energy security concerns (India imports approximately 80% of its crude oil). The country has seen dramatic cost reductions in solar energy, with utility-scale solar now often the cheapest source of new power.
Middle East
The Middle East holds some of the world’s largest reserves of oil and natural gas and has historically dominated global fossil fuel exports.
Key facts:
- The Middle East holds approximately 48% of the world’s proven oil reserves (OPEC Annual Statistical Bulletin)
- Saudi Aramco is the world’s largest oil company by production
- The UAE has built the Barakah Nuclear Power Plant (the Arab world’s first), and is investing heavily in solar
Countries like Saudi Arabia, the UAE, and Qatar are diversifying their economies and energy systems in anticipation of the global energy transition. The UAE’s Al Dhafra Solar PV project (2.1 GW) is one of the world’s largest solar plants. Saudi Arabia is developing NEOM, which aims to be powered entirely by renewable energy.
11. International Energy Organizations
Several major global organizations shape energy policy, data collection, and market coordination.
International Energy Agency (IEA): Founded in 1974 in response to the oil crisis, the IEA provides data, analysis, and policy recommendations on energy security, economic development, and environmental awareness. It has 31 member countries and publishes the influential annual World Energy Outlook and Electricity Market Report.
International Renewable Energy Agency (IRENA): Established in 2009 and based in Abu Dhabi, IRENA is the primary international organization promoting the adoption and use of renewable energy. It tracks renewable energy costs, capacity, and employment worldwide. Its annual Renewable Capacity Statistics report is a standard reference.
Organization of the Petroleum Exporting Countries (OPEC): Founded in 1960, OPEC coordinates oil production policy among its 13 member countries (including Saudi Arabia, Iraq, Iran, UAE, Venezuela, and others). OPEC+ (which includes Russia and other non-OPEC producers) collectively controls a significant portion of global oil supply.
U.S. Energy Information Administration (EIA): The statistical arm of the U.S. Department of Energy, EIA provides some of the world’s most comprehensive and reliable energy data. Its Short-Term Energy Outlook and Annual Energy Outlook are widely referenced by industry and researchers.
World Energy Council (WEC): A network of over 3,000 organizations in approximately 90 countries, WEC focuses on global energy policy, sustainability, and access. It publishes the triennial World Energy Trilemma Index, ranking countries on energy security, equity, and environmental sustainability.
12. Renewable Energy Sources
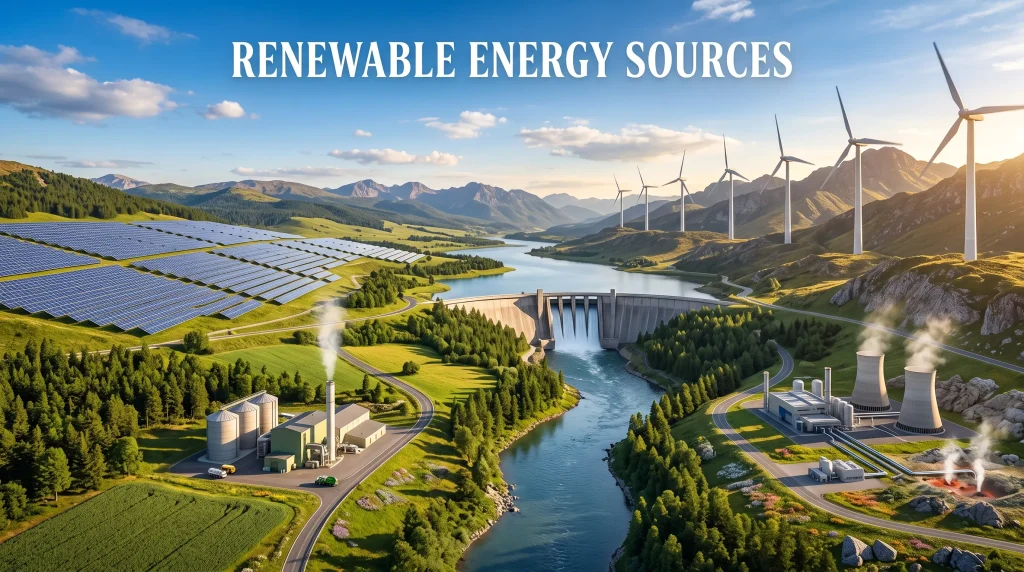
Renewable energy is derived from naturally replenishing sources that are virtually inexhaustible on human timescales. Renewable sources produce little to no greenhouse gas emissions during electricity generation, making them central to the global effort to address climate change.
According to IRENA, renewable energy employed 13.7 million people globally in 2022 and accounted for a record 87% of all new electricity capacity added worldwide in 2023.
Solar Energy
Solar energy is the energy from sunlight, harnessed through two main technologies: photovoltaic (PV) systems and solar thermal systems.
Photovoltaic (PV) Technology: Solar PV cells are made primarily from silicon and convert sunlight directly into electricity through the photovoltaic effect. When photons from sunlight strike the silicon, they knock electrons loose, creating an electric current.
Commercial solar PV panels now achieve efficiencies of 20 to 23% for standard silicon panels, while high-efficiency panels can reach 24 to 27%. Perovskite solar cells in laboratory settings have achieved efficiencies exceeding 33% in tandem configurations.
Cost trajectory: The Levelized Cost of Energy (LCOE) for utility-scale solar PV fell from approximately $0.381 per kWh in 2010 to just $0.049 per kWh in 2023 (IRENA) – a reduction of approximately 89%. This makes solar the cheapest source of new electricity generation in history.
Global installed capacity: Total global solar PV capacity reached approximately 1,600 GW by end of 2023, with China, the EU, and the U.S. leading installations (IRENA).
Concentrated Solar Power (CSP): CSP uses mirrors or lenses to concentrate sunlight onto a receiver, generating heat that drives a steam turbine. Unlike PV, CSP can incorporate thermal energy storage using molten salt, allowing generation to continue for hours after sunset. The Noor Ouarzazate complex in Morocco (580 MW) is one of the world’s largest CSP facilities.
Wind Energy
Wind energy converts the kinetic energy of moving air into electricity using turbines. Wind is created by the differential heating of Earth’s surface by the sun, making it an indirect form of solar energy.
How wind turbines work: Wind forces the turbine blades to rotate, which turns a shaft connected to a generator. Modern utility-scale wind turbines have hub heights of 80 to 120 meters and rotor diameters of 90 to 170 meters. Turbines begin generating at wind speeds of approximately 3 to 4 meters per second and reach maximum output (rated power) at around 12 to 15 meters per second.
Onshore wind: Global onshore wind capacity exceeded 900 GW by end of 2023 (GWEC). The U.S., China, Germany, India, and Spain are leading markets. Onshore wind LCOE fell to $0.033 per kWh globally in 2023 (IRENA), making it one of the cheapest energy sources worldwide.
Offshore wind: Offshore turbines benefit from stronger, more consistent winds and can be built larger than onshore turbines due to fewer transportation constraints. The world’s largest offshore wind turbine as of 2024 is Siemens Gamesa’s SG 14-236 DD, with a 14 MW capacity and a rotor diameter of 236 meters (large enough to cover more than four football fields). Global offshore wind capacity reached approximately 75 GW in 2023 (GWEC), with the UK, China, and Germany as leaders.
Hydropower
Hydropower generates electricity using the potential energy of water stored at elevation or the kinetic energy of flowing rivers. It is the world’s largest source of renewable electricity.
Global capacity: Hydropower provides approximately 16% of global electricity and over 40% of global renewable electricity (IEA, 2023). Total installed capacity exceeds 1,400 GW worldwide.
Types of hydropower:
- Reservoir (impoundment) hydro: Dams store water, releasing it through turbines on demand. The Three Gorges Dam in China (22.5 GW) is the world’s largest power plant by installed capacity.
- Run-of-river: Uses the natural flow of a river without large storage. Less controllable but causes less environmental disruption.
- Pumped hydro storage: Uses excess electricity to pump water uphill, storing energy that is released by letting water flow back down through turbines when needed. This provides over 90% of global grid storage capacity.
- Small hydro and micro-hydro: Systems below 10 MW (small) or 100 kW (micro), used for remote community power.
Advantages: Hydropower is highly controllable, with large plants able to change output within seconds. It provides baseload power (constant generation) or peak power (on-demand generation).
Geothermal Energy
Geothermal energy is derived from the natural heat within the Earth’s crust. The Earth’s interior generates heat through radioactive decay of elements like uranium, thorium, and potassium, supplemented by residual heat from the planet’s formation.
Applications: Geothermal energy is used for electricity generation (using high-temperature steam or hot water from geothermal reservoirs) and direct heating (district heating systems, greenhouses, industrial drying processes).
Leading countries: Iceland gets approximately 25% of its electricity from geothermal sources. The Philippines, Kenya, New Zealand, and the United States (particularly California and Nevada) are also significant producers. The Cerro Prieto geothermal field in Mexico (720 MW) is one of the largest worldwide.
Emerging technology: Enhanced Geothermal Systems (EGS) aim to make geothermal viable in areas without natural reservoirs by drilling deep wells and fracturing hot dry rock to create artificial geothermal systems. Companies like Fervo Energy have demonstrated commercial EGS projects in the U.S.
Global capacity: Total installed geothermal capacity is approximately 16 GW worldwide, though this understates its value because geothermal plants run nearly continuously (capacity factors of 80 to 95%), providing exceptionally reliable baseload power.
Biomass Energy
Biomass energy is produced from organic materials including wood, agricultural residue, energy crops, and organic waste. Biomass can be burned directly for heat and electricity, converted into biogas through anaerobic digestion, or processed into liquid biofuels.
Types of biomass:
- Woody biomass: Forest residues, wood pellets, sawmill waste
- Agricultural biomass: Crop residues (straw, bagasse), energy crops (miscanthus, switchgrass)
- Organic waste: Municipal solid waste, food waste, sewage sludge
- Algae: High-yield feedstock for biofuels with minimal land requirements
Biofuels: Ethanol (produced from sugarcane, corn, or cellulosic material) and biodiesel (produced from vegetable oils or animal fats) are the main liquid biofuels used in transportation. Global biofuel production in 2022 was approximately 170 billion liters (IEA).
Sustainability considerations: Biomass is only truly renewable if sourced sustainably. Deforestation or conversion of natural habitats for energy crops can produce higher net emissions than fossil fuels. The EU Renewable Energy Directive (RED III) sets sustainability criteria for biomass used in the EU.
Tidal and Wave Energy
Tidal energy captures the rise and fall of ocean tides using tidal barrages (dam-like structures across estuaries) or underwater tidal stream generators (turbines on the seafloor that work like underwater wind turbines). Tidal energy is highly predictable because tides follow astronomical cycles.
The La Rance Tidal Barrage in France (240 MW, operating since 1966) remains the largest tidal barrage in the world. Tidal stream arrays are being developed in the Pentland Firth between Scotland and Orkney, one of the world’s most energetic tidal resources.
Wave energy captures the kinetic and potential energy of ocean surface waves. Various device types are under development, including oscillating water columns, point absorbers, and attenuators. Wave energy has a significant global resource potential estimated at 2,000 to 4,000 TWh per year (Ocean Energy Systems), but it remains pre-commercial due to engineering challenges in the harsh marine environment.
Ocean Thermal Energy Conversion (OTEC)
OTEC exploits the temperature difference between warm surface seawater (approximately 25 to 28 degrees Celsius in tropical regions) and cold deep seawater (approximately 4 to 5 degrees Celsius at depths of 800 to 1,000 meters). This temperature difference drives a thermodynamic cycle to generate electricity.
OTEC is best suited to tropical regions and can also produce desalinated fresh water as a byproduct. However, the technology requires substantial capital investment and remains at the demonstration stage, with only a few small operational plants worldwide.
13. Non-Renewable Energy Sources
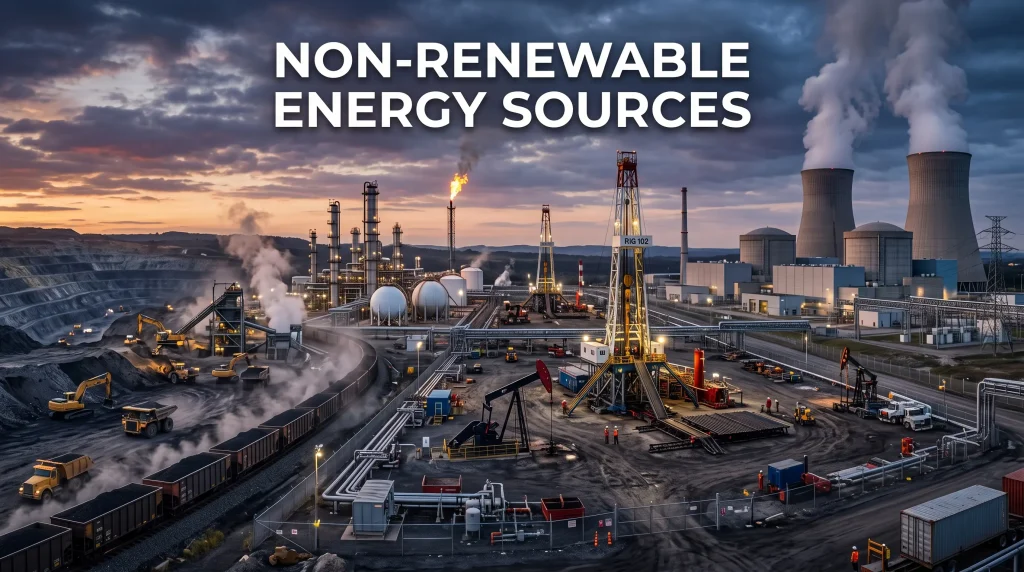
Non-renewable energy sources exist in finite quantities formed over millions of years and are depleted much faster than they can be replenished. They currently supply the majority of global energy but are declining in their share as renewables grow.
Coal
Coal is a carbon-rich sedimentary rock formed from ancient plant matter over 300 to 360 million years. It is classified by carbon content and energy density: lignite (lowest), sub-bituminous, bituminous, and anthracite (highest quality, highest carbon content).
Global role: Coal provided approximately 27% of global primary energy in 2022 (IEA) and 36% of global electricity generation. China is by far the largest consumer, accounting for over 50% of global coal consumption.
Environmental impact: Coal combustion is the single largest source of energy-related carbon dioxide emissions. It also releases sulfur dioxide, nitrogen oxides, particulate matter, mercury, and other pollutants, making it the most environmentally damaging fossil fuel.
Decline: Coal use in advanced economies has declined sharply. In the U.S., coal’s share of electricity generation fell from 50% in 2005 to approximately 16% in 2023 (EIA), displaced by cheap natural gas and increasingly competitive renewables.
Proven reserves: Global proven coal reserves were estimated at approximately 1.07 trillion tonnes in 2022 (BP Statistical Review), sufficient for roughly 130+ years at current production rates.
Petroleum (Oil)
Crude oil is a liquid hydrocarbon mixture formed from marine organisms over millions of years under heat and pressure. It is extracted from underground reservoirs and refined into gasoline, diesel, jet fuel, heating oil, and hundreds of petrochemical products.
Global role: Oil is the world’s largest energy source by primary energy, supplying approximately 31% of global primary energy (IEA, 2023). Transportation accounts for approximately 60% of global oil demand.
Proven reserves: Global proven oil reserves stood at approximately 1.7 trillion barrels as of 2022 (BP), with the Middle East holding the largest share (~48%). At current production rates, this represents approximately 50 years of supply from proven reserves alone, though new discoveries and technology improvements continuously update reserve estimates.
Price dynamics: Oil markets are characterized by significant price volatility. Brent crude oil prices ranged from a low of approximately $-37 per barrel in April 2020 (during the COVID-19 demand collapse, a historic anomaly reflecting storage constraints) to over $130 per barrel in March 2022 following Russia’s invasion of Ukraine. Long-term price drivers include OPEC production decisions, global economic conditions, U.S. shale output, and the pace of the energy transition.
Natural Gas
Natural gas is a fossil fuel composed primarily of methane (CH4), along with smaller amounts of ethane, propane, and other hydrocarbons. It is found in underground reservoirs, often associated with oil deposits.
Uses: Natural gas is used for electricity generation (the most common use in advanced economies), residential and commercial heating and cooking, industrial processes, and as a feedstock for the chemical and fertilizer industry.
Advantages over coal: Natural gas emits approximately 50% less CO2 per unit of energy than coal when burned for electricity generation. It also produces significantly less air pollution (almost no sulfur dioxide, lower particulate emissions).
Liquefied Natural Gas (LNG): When cooled to -162 degrees Celsius, natural gas becomes liquid, reducing its volume to 1/600th of its gaseous state. LNG can be transported in specialized tankers to markets without pipeline access. Global LNG trade reached approximately 400 million tonnes in 2023 (Shell LNG Outlook), with Australia, Qatar, and the U.S. as leading exporters.
Proven reserves: Global proven natural gas reserves are approximately 188 trillion cubic meters (tcm), sufficient for approximately 50 years at current production rates (BP Statistical Review, 2023).
Shale Gas and Hydraulic Fracturing: Shale gas is natural gas trapped within shale rock formations. The combination of horizontal drilling and hydraulic fracturing (fracking) unlocked vast shale gas and oil reserves, particularly in the United States. U.S. natural gas production grew by approximately 80% between 2008 and 2023, transforming global gas markets. Fracking involves injecting high-pressure fluid (water, sand, and chemical additives) into shale formations to fracture the rock and release trapped gas or oil.
Nuclear Energy
Nuclear energy is generated through nuclear fission, the process of splitting heavy atomic nuclei (usually uranium-235 or plutonium-239) to release large amounts of energy as heat.
Scale of energy release: A single kilogram of uranium-235, when fully fissioned, releases approximately 83 terajoules of energy – equivalent to burning approximately 2,700 tonnes of coal.
Global role: Nuclear power provided approximately 10% of global electricity generation in 2022 (World Nuclear Association). France gets approximately 70% of its electricity from nuclear, the highest share of any country. The U.S. has the world’s largest nuclear fleet (93 operational reactors as of 2024).
Operational profile: Nuclear plants provide firm, baseload power with very high capacity factors – typically 85 to 95%, far higher than any other power source.
Waste management: Used nuclear fuel is highly radioactive and requires secure, long-term management. While the volume of nuclear waste is actually quite small compared to other industrial waste streams, its radioactivity and the requirement for geological storage for thousands of years make it a significant policy and engineering challenge.
Generation types:
- Gen I: Early prototype reactors (1950s to 1960s)
- Gen II: Most current operational reactors
- Gen III/III+: Advanced designs with improved safety (AP1000, EPR)
- Gen IV: Future reactors with enhanced safety, efficiency, and waste profiles (still mostly in development)
Hydrogen as an Energy Carrier
Hydrogen (H2) is the universe’s most abundant element, but on Earth it does not occur naturally in free molecular form in significant quantities. It must be produced from other sources, making it an energy carrier rather than a primary energy source.
Production pathways and color coding:
| Color | Production Method | CO2 Emissions |
|---|---|---|
| Grey | Steam methane reforming of natural gas, no carbon capture | High (~10 kg CO2 per kg H2) |
| Brown/Black | Gasification of coal or lignite | Very high |
| Blue | Steam methane reforming with carbon capture and storage (CCS) | Low to moderate |
| Turquoise | Methane pyrolysis (produces solid carbon) | Low |
| Green | Electrolysis of water using renewable electricity | Near zero |
| Pink/Purple | Electrolysis powered by nuclear electricity | Near zero |
| White | Natural geological hydrogen deposits | Near zero (rare) |
Current production: Over 95% of hydrogen produced today is grey hydrogen (IEA). Green hydrogen is growing rapidly but remains more expensive than grey hydrogen in most markets, primarily because of the cost of renewable electricity and electrolyzers.
Applications: Hydrogen is particularly valuable for decarbonizing hard-to-electrify sectors such as steel manufacturing (replacing metallurgical coal), chemicals (ammonia production), long-distance aviation and shipping, and seasonal energy storage.
The global green hydrogen market is projected to grow from under $1 billion in 2022 to over $100 billion by 2030 according to various market forecasts, though actual timelines depend heavily on policy support and electrolyzer cost reductions.
14. Energy Density and Fuel Comparison
Energy density is the amount of energy stored per unit of mass (gravimetric energy density, in Wh/kg or MJ/kg) or per unit of volume (volumetric energy density, in Wh/L or MJ/L).
Gravimetric Energy Density Comparison
| Fuel/Storage | Gravimetric Energy Density | Notes |
|---|---|---|
| Hydrogen (compressed) | 33,000 Wh/kg (119 MJ/kg) | Very high by mass, very low by volume |
| Natural Gas | 13,900 Wh/kg (50 MJ/kg) | Gaseous at ambient conditions |
| Gasoline | 12,900 Wh/kg (46.4 MJ/kg) | Standard reference for transport fuels |
| Diesel | 12,500 Wh/kg (45 MJ/kg) | Slightly higher density than gasoline |
| Jet Fuel (Kerosene) | 12,000 Wh/kg (43.2 MJ/kg) | Aviation standard |
| LPG (Propane) | 12,900 Wh/kg (46.4 MJ/kg) | Similar to gasoline |
| Coal (bituminous) | 7,700 Wh/kg (27.8 MJ/kg) | Varies significantly by grade |
| Lithium-Ion Battery | 100 to 300 Wh/kg | Improving rapidly |
| Lead-Acid Battery | 30 to 50 Wh/kg | Mature, low cost |
| Wood (dry) | 4,400 Wh/kg (15.8 MJ/kg) | Traditional biomass |
Key insight: Fossil fuels have dramatically higher energy density than current batteries, which is why battery electric aircraft remain challenging for long ranges and why battery electric ships require massive battery packs. However, for most road transport applications (passenger cars, trucks up to certain ranges), battery energy density is now sufficient.
15. How Electricity Is Generated
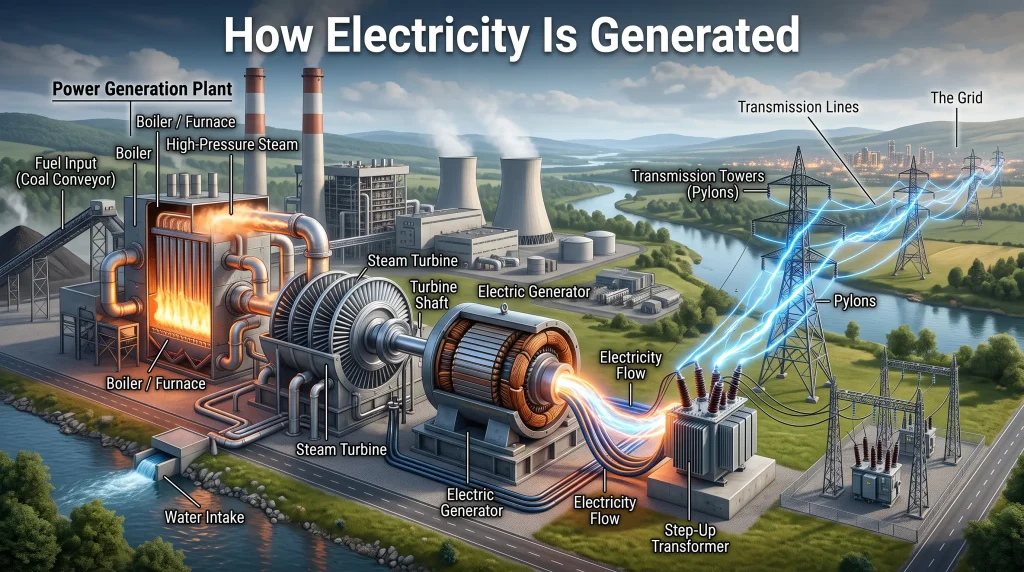
Electricity generation is the process of converting primary energy (thermal, mechanical, chemical, nuclear, or radiant) into electrical energy. Understanding this process is fundamental to understanding the entire electricity industry.
The Basic Principle: Electromagnetic Induction
In 1831, Michael Faraday discovered that moving a conductor through a magnetic field induces an electric current. This principle of electromagnetic induction remains the basis for virtually all large-scale electricity generation, from coal plants to hydroelectric dams to wind farms.
The fundamental device is the electric generator: a rotating machine that converts mechanical energy into electrical energy. When a coil of conducting wire rotates within a magnetic field (or when a magnetic field rotates around a stationary coil), it generates an alternating electrical current.
The Electricity Generation Chain
- Primary energy source (fossil fuel, nuclear fuel, wind, water, solar radiation)
- Energy conversion to mechanical energy (turbine rotation)
- Mechanical to electrical conversion (generator)
- Voltage step-up (transformer at power plant)
- High-voltage transmission (overhead lines or cables)
- Voltage step-down (transformer at substation)
- Distribution (to homes, businesses, industry)
- End use (appliances, machinery, lighting)
Exceptions to this chain include solar PV (which generates electricity directly without mechanical rotation) and fuel cells (which convert chemical energy to electricity electrochemically).
You May Also Like It:
Solar Panel Maintenance: The Complete Guide
Solar Battery Storage: The Complete 2026 Guide for US Homeowners
16. Types of Power Plants
Thermal Power Plants (Coal, Oil, Gas)
Thermal power plants burn fossil fuels to produce steam, which drives a steam turbine connected to a generator.
Process: Fuel combustion -> Water heating in boiler -> High-pressure steam -> Steam turbine rotation -> Generator output
Efficiency: Conventional subcritical coal plants operate at approximately 33 to 38% efficiency. Modern ultra-supercritical coal plants can achieve 44 to 48% efficiency by operating at higher steam temperatures and pressures (above 600 degrees Celsius and 300 bar).
Scale: Individual coal plant units typically range from 100 MW to over 1,000 MW. The world’s largest thermal power station is the Taichung Power Plant in Taiwan (5,500 MW combined capacity).
Nuclear Power Plants
Nuclear plants use nuclear fission to heat water and produce steam to drive turbines. There is no combustion; the energy comes from the nuclear reaction.
Types of reactors in operation:
- Pressurized Water Reactor (PWR): Most common worldwide. Uses pressurized light water as coolant and moderator.
- Boiling Water Reactor (BWR): Water boils in the reactor vessel to produce steam directly.
- CANDU (CANada Deuterium Uranium): Uses heavy water and can be refueled while operating.
- RBMK: Soviet-era design (the type at Chernobyl, no longer being built).
Nuclear plants typically have high capital costs but low fuel costs and very low operating costs per kWh. Their LCOE (factoring in capital, operations, waste management, and decommissioning) ranges from approximately $0.06 to $0.21 per kWh depending on country, financing conditions, and plant age (OECD NEA).
Hydroelectric Power Plants
Water stored at elevation or flowing in rivers drives turbines directly connected to generators. No steam cycle is required.
Types of water turbines:
- Francis turbine: Suitable for medium head (45 to 400 meters) and medium to high flow. Most common worldwide.
- Kaplan turbine: Suitable for low head (5 to 80 meters) and high flow. Used in run-of-river plants.
- Pelton turbine: Suitable for very high head (200 to 1,800+ meters) and low flow. Used in mountainous regions.
Hydroelectric plants are highly efficient (typically 85 to 95%) and have very long operational lifespans (50 to 100+ years).
Gas Power Plants
Simple cycle gas turbines burn natural gas in a combustion chamber, and the hot exhaust gas expands through turbine blades to generate power directly. These plants can start quickly (within minutes) and are often used for peak demand response. Efficiency is typically 33 to 40%.
Combined Cycle Gas Turbines (CCGT) capture the waste exhaust heat from the gas turbine in a heat recovery steam generator (HRSG) to produce steam for a separate steam turbine. This achieves efficiency of 55 to 62%, making CCGT the most efficient large-scale fossil fuel power technology currently available. CCGT plants typically range from 400 MW to over 1,000 MW.
Solar Power Plants
Utility-scale solar PV farms use thousands of PV panels installed on ground-mounted racking systems with solar tracking capability (single-axis or dual-axis trackers). Tracking systems increase output by 15 to 30% compared to fixed-tilt systems.
Concentrated Solar Power (CSP) plants use heliostats (large computer-controlled mirrors) to concentrate sunlight onto a central receiver (tower), heating a molten salt working fluid to temperatures above 500 degrees Celsius. The thermal energy can be stored in insulated tanks for 6 to 15 hours, enabling generation after sunset. CSP with thermal storage provides dispatchable solar power, unlike PV.
Wind Farms
Wind farms consist of multiple turbines connected to a shared grid connection point (substation). Onshore wind farms typically range from tens of MW to several hundred MW. Offshore wind farms can exceed 1,000 MW (1 GW).
Modern offshore wind records:
- Hornsea 2 (UK): 1.3 GW capacity, 165 turbines (largest operational offshore wind farm as of 2023)
- Dogger Bank (UK): 3.6 GW when fully complete (under construction)
Diesel Generators
Diesel generators convert diesel fuel into electricity through an internal combustion engine driving a generator. They are used primarily for:
- Backup power for hospitals, data centers, and industrial facilities
- Remote power in areas without grid access
- Mobile power for construction, events, and emergency response
Diesel generators range from small portable units (a few kW) to large industrial units (10 MW+). They are reliable but have higher fuel costs and CO2 emissions than grid power. Global diesel generator market was valued at over $20 billion in 2022 (Grand View Research).
Waste-to-Energy Plants
Waste-to-energy (WtE) facilities generate electricity and heat by combusting municipal solid waste (MSW) or through biological processes (anaerobic digestion producing biogas).
Combustion WtE: Municipal waste is burned in specially designed furnaces at high temperatures (850 degrees Celsius minimum under EU regulations) to prevent dioxin formation. Heat is recovered to generate steam for turbines. Modern WtE plants also use extensive flue gas cleaning systems to control emissions of particulate matter, dioxins, heavy metals, and acid gases.
Anaerobic digestion (AD): Organic waste is broken down by bacteria in the absence of oxygen, producing biogas (primarily methane). Biogas can be burned for electricity and heat or upgraded to biomethane for injection into the gas grid or use as vehicle fuel.
Global WtE capacity was approximately 330 GW thermal in 2022 (IEA), concentrated in Europe, East Asia, and North America.
17. Turbines and Generators
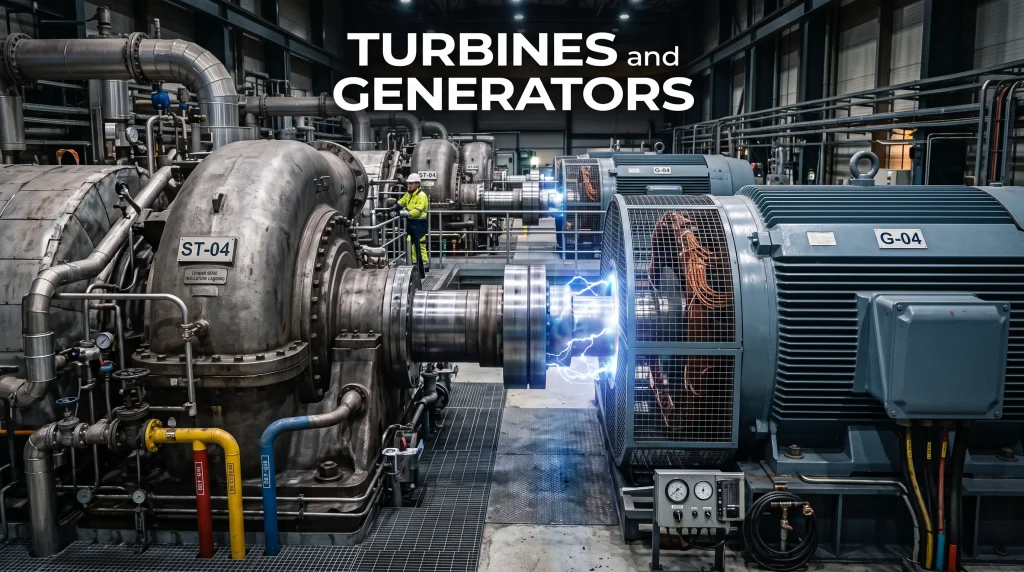
Overview of Turbine Types
| Turbine Type | Primary Fuel/Driver | Main Application | Efficiency Range |
|---|---|---|---|
| Steam turbine | Steam from fossil fuel, nuclear, or CSP | Thermal and nuclear power plants | 40 to 48% |
| Gas turbine | Natural gas, diesel, biogas | Peak power, combined cycle | 33 to 43% |
| Combined cycle (gas + steam) | Natural gas | Baseload gas power | 55 to 62% |
| Wind turbine | Wind (kinetic energy) | Onshore/offshore wind farms | 35 to 45% of wind energy |
| Francis turbine | Water (medium head) | Most hydroelectric plants | 85 to 95% |
| Kaplan turbine | Water (low head, high flow) | Run-of-river, tidal | 80 to 93% |
| Pelton turbine | Water (high head, low flow) | Mountain hydroelectric | 85 to 95% |
| Micro turbine | Natural gas, biogas | Distributed generation, CHP | 25 to 35% |
Steam Turbines
Steam turbines convert the thermal energy of pressurized steam into mechanical energy through the rotation of blades on a shaft. They are used in virtually all large thermal and nuclear power plants.
Operation: High-pressure steam from the boiler enters the turbine and expands through successive stages of stationary nozzles and rotating blades, losing pressure and temperature as it transfers energy to the shaft. Modern large steam turbines are multi-stage, with high-pressure (HP), intermediate-pressure (IP), and low-pressure (LP) sections.
Scale: Large steam turbines for utility-scale power plants can have outputs of 500 to 1,800 MW from a single machine and can operate for decades with proper maintenance.
Gas Turbines
Gas turbines (also called combustion turbines) use the Brayton cycle: air is compressed, fuel is injected and ignited, and the hot combustion gases expand through the turbine, driving the compressor and the generator.
Key advantage: Fast startup times (minutes compared to hours for steam turbines) make gas turbines ideal for peaking power and grid balancing. Modern aeroderivative gas turbines (adapted from aircraft jet engines) can reach full power in under 10 minutes.
Wind Turbines
Modern horizontal-axis wind turbines (HAWT) consist of:
- Rotor blades (typically 3): Airfoil-shaped to generate lift, causing rotation
- Hub: Connects blades to the main shaft
- Main shaft and gearbox (or direct drive): Transmits rotation to the generator
- Generator: Converts mechanical rotation to electricity
- Nacelle: Housing for mechanical components, sits atop the tower
- Tower: Elevates turbine to capture stronger winds
- Foundation: Onshore (concrete) or offshore (monopile, jacket, or floating)
Power output formula: Wind turbine power is proportional to the cube of wind speed. Doubling wind speed increases power output by a factor of eight. This is why turbine siting in high-wind locations is so important.
Generators
Generators convert mechanical energy into electrical energy through electromagnetic induction. The two main types used in power systems are:
Synchronous Generators: Rotate in synchrony with the grid frequency (50 or 60 Hz). Used in conventional power plants (thermal, nuclear, hydro). They maintain a fixed relationship between rotor rotation and grid frequency. Large synchronous generators provide inertia to the grid, which is important for frequency stability.
Induction Generators: Commonly used in wind turbines and some small hydro plants. They operate asynchronously (at variable speeds relative to grid frequency) and require power electronics to interface with the grid. They are simpler and more rugged than synchronous generators.
Permanent Magnet Generators (PMG): Used in modern direct-drive wind turbines (eliminating the gearbox). They are highly reliable because the gearbox (historically a major maintenance item) is eliminated. Siemens Gamesa, Vestas, and GE are among the major wind turbine manufacturers using this technology.
18. Advanced Power Generation
Cogeneration (Combined Heat and Power – CHP)
Cogeneration, or Combined Heat and Power (CHP), simultaneously produces electricity and useful heat from a single fuel source, dramatically improving overall fuel utilization.
Efficiency comparison:
- Separate electricity generation (power plant): 35 to 45% efficiency
- Separate heat generation (boiler): 80 to 90% efficiency
- CHP system: 70 to 90% overall efficiency (electricity + useful heat)
A CHP system that achieves 80% overall efficiency uses the same fuel to produce both electricity and heat, wasting only 20% of the fuel’s energy content. A conventional power plant wasting 60% to generate electricity, combined with a separate boiler wasting 10% to provide heat, wastes 55% of the combined fuel input (given the relative energy mixes).
Applications: Industrial facilities (paper, chemical, food processing), hospitals, universities, district heating systems, data centers, and commercial buildings.
Global market: The global CHP installed capacity was approximately 950 GW in 2022, with China, the U.S., and Russia having the largest capacities.
Trigeneration (Combined Cooling, Heat, and Power – CCHP)
Trigeneration extends cogeneration by adding cooling to the outputs. The waste heat from the power generation cycle drives an absorption chiller that produces chilled water for air conditioning and refrigeration.
This makes trigeneration particularly valuable in hot climates or for facilities with year-round cooling needs such as hospitals, hotels, airports, and shopping centers.
Overall energy efficiency of trigeneration systems can reach 75 to 85%, and in some optimized systems, over 90%.
Distributed Generation (DG)
Distributed generation refers to power generation located close to where electricity is consumed, rather than at centralized power plants connected to a long transmission network.
Examples: Rooftop solar PV, on-site diesel generators, CHP systems, fuel cells, small wind turbines, and battery storage systems.
Advantages:
- Reduces transmission and distribution losses (which average approximately 5 to 8% of electricity generated in developed grids)
- Improves resilience (local generation continues even during grid outages)
- Enables communities and businesses to generate their own power
- Supports renewable energy integration by locating generation close to consumption
Microgrids are integrated distributed energy systems (generation + storage + controls) that can operate either connected to the main grid or as an island (independently). Military bases, universities, island communities, and some municipalities use microgrids to improve resilience and integrate renewable energy.
19. Electrical Systems and Grid Infrastructure
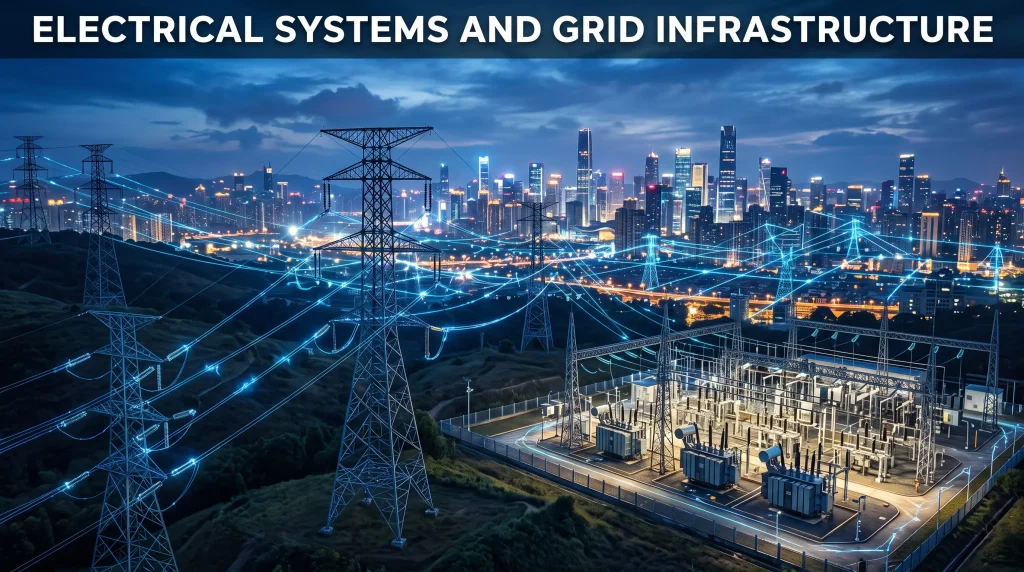
The electrical grid is one of humanity’s most complex engineering achievements: a system that must continuously balance supply and demand, delivering electricity reliably across continents to billions of people.
How the Grid Works
The electrical grid consists of three main segments:
Generation: Power plants produce electricity, typically at voltages of 11 kV to 33 kV (kilovolts).
Transmission: Step-up transformers increase voltage to 66 kV to 765 kV or higher for long-distance transmission. Higher voltage means lower current for the same power, which dramatically reduces resistive energy losses in the wires (losses are proportional to current squared times resistance).
Distribution: Step-down transformers reduce voltage to 11 kV or 33 kV at distribution substations, and then to 230 V or 120 V (depending on country standard) for delivery to homes and small businesses. Large industrial consumers may receive power at medium voltage (11 to 66 kV) directly.
Transformers
A transformer transfers electrical energy between circuits using electromagnetic induction. It can step voltage up (increasing voltage, decreasing current) or down (decreasing voltage, increasing current) without changing the frequency.
Types:
- Power transformers: Large units used in transmission (10 MVA to 1,000+ MVA)
- Distribution transformers: Smaller units stepping voltage down for local delivery (10 kVA to 10 MVA)
- Instrument transformers: Current transformers (CTs) and voltage transformers (VTs) used for measurement and protection
Efficiency: Modern large power transformers operate at 99.3 to 99.7% efficiency, minimizing losses during long-distance power transmission.
Circuit Breakers and Switchgear
A circuit breaker automatically interrupts current flow when it detects abnormal conditions such as overloads, short circuits, or earth faults. Unlike fuses (which must be replaced after operation), circuit breakers are resettable.
Types include:
- Air-blast circuit breakers
- Oil circuit breakers
- Vacuum circuit breakers (for distribution voltages)
- SF6 (sulfur hexafluoride) circuit breakers for high-voltage applications (though SF6 is a potent greenhouse gas, with over 23,000 times the warming potential of CO2, and is increasingly being replaced)
Switchgear is the combination of switches, fuses, circuit breakers, and associated controls used to control, protect, and isolate electrical equipment. It allows sections of the network to be de-energized for maintenance or fault isolation.
Substations
A substation is a facility housing transformers, switchgear, protection equipment, and control systems. It serves as a critical node in the transmission and distribution network.
Types include:
- Step-up substations at power plants (generator voltage to transmission voltage)
- Transmission substations (changing transmission voltage levels)
- Distribution substations (transmission to distribution voltage)
- Customer substations (distribution to end-user voltage for large customers)
Transmission Lines
Overhead transmission lines carry electricity on conductors suspended from towers at heights of 30 to 80 meters. Conductors are typically made of ACSR (Aluminum Conductor Steel Reinforced), using aluminum for conductivity and steel for mechanical strength.
Underground cables are used in urban areas, across water crossings, and in environmentally sensitive locations. They are more expensive than overhead lines (5 to 15 times more costly per kilometer for AC systems) but have lower visual impact and less susceptibility to weather events.
Transmission losses: In a well-maintained grid, transmission losses are approximately 2 to 3% of electricity generated. Distribution losses add another 2 to 5%. Together, these make total grid losses typically 5 to 8% in advanced economies (higher in some developing country grids where infrastructure is older).
Smart Grid
A smart grid is a modernized electrical grid that uses digital communication technology, sensors, automation, and data analytics to improve efficiency, reliability, and flexibility.
Key components:
- Advanced Metering Infrastructure (AMI): Smart meters that communicate usage data in real time, enabling time-of-use pricing and demand response
- Distribution automation: Automated sensors and switches that detect faults and reroute power automatically
- Energy management systems (EMS): Centralized control systems monitoring and controlling the grid
- Wide Area Measurement Systems (WAMS): Phasor measurement units (PMUs) providing real-time grid-wide monitoring
Global smart grid investment: Global smart grid investment was approximately $70 billion in 2022 (IEA) and is projected to grow significantly as grids integrate more renewable energy and electric vehicles.
HVDC Transmission
High-Voltage Direct Current (HVDC) transmission carries electricity as direct current rather than alternating current. For very long distances (typically over 600 to 800 km for overhead lines, and over 50 km for undersea cables), HVDC is more efficient than AC because:
- DC lines have no reactive power losses
- HVDC can connect two asynchronous AC grids
- HVDC underground and undersea cables are more practical than AC for long subsea distances
HVDC in practice: The Ultranet project in Germany uses HVDC to transmit power from windy northern Germany to industrial southern Germany. The Western HVDC Link (UK) connects Scotland and Wales via a 2,200 MW undersea cable. China has the world’s most extensive HVDC network, with lines exceeding 3,000 km in length.
Voltage Source Converters (VSC-HVDC): Modern HVDC systems use VSC technology, which allows independent control of active and reactive power, black-start capability (ability to re-energize a de-energized line), and connection of offshore wind farms.
FACTS Devices
Flexible AC Transmission System (FACTS) devices use power electronics to improve the controllability, stability, and capacity of AC transmission networks.
Types include:
- Static VAR Compensator (SVC): Regulates voltage by injecting or absorbing reactive power
- Static Synchronous Compensator (STATCOM): More advanced reactive power compensation using voltage source converter technology
- Thyristor Controlled Series Capacitor (TCSC): Controls power flow on specific transmission lines
- Unified Power Flow Controller (UPFC): The most versatile FACTS device, controlling voltage, impedance, and phase angle simultaneously
Superconducting Power Transmission
Superconducting materials carry electricity with virtually zero electrical resistance when cooled below their critical temperature (which varies by material). This would eliminate transmission losses entirely in a superconducting grid.
Current state: High-temperature superconductors (HTS) operate at temperatures achievable with liquid nitrogen (-196 degrees Celsius), which is far more practical than low-temperature superconductors that require liquid helium. Several demonstration HTS cable projects exist (including in Germany, Japan, South Korea, and the U.S.), but high costs and cooling requirements currently limit commercial deployment.
20. Electrical Fundamentals
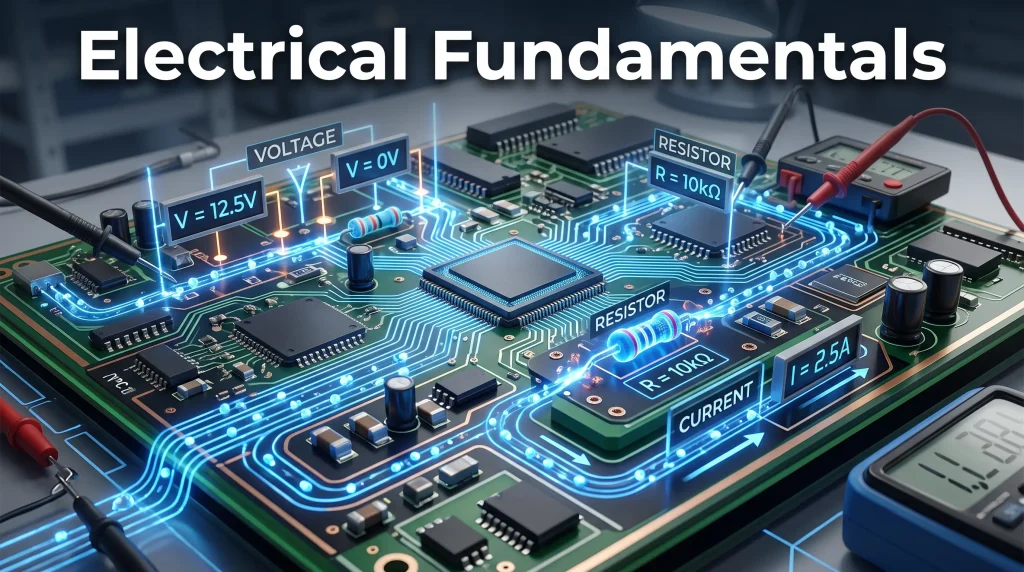
Core Electrical Quantities
Voltage (V): The electric potential difference between two points in a circuit, measured in volts (V). It is the “pressure” that drives electric current. Voltage is always measured between two points; there is no absolute voltage.
Current (I): The flow of electric charge (electrons) through a conductor, measured in amperes (A). Direct current (DC) flows in one constant direction (batteries, solar panels, electronics). Alternating current (AC) periodically reverses direction (grid electricity).
Resistance (R): The opposition a material offers to current flow, measured in ohms (symbol: Greek letter omega). Conductors have very low resistance (copper: 1.7 x 10^-8 ohm-meters). Insulators have very high resistance (rubber, glass). Semiconductors have intermediate resistance that can be precisely controlled.
Impedance (Z): The total opposition to current flow in an AC circuit, combining resistance and reactance. Reactance arises from inductors (which oppose changes in current) and capacitors (which oppose changes in voltage). Impedance is expressed as a complex number: Z = R + jX, where R is resistance and X is reactance.
Power Factor (PF): The ratio of real power (watts) to apparent power (volt-amperes) in an AC circuit. It ranges from 0 to 1. A power factor of 1 means all power is used productively. A power factor of 0.8 means 80% of apparent power does useful work. Low power factor causes extra current to flow through cables and transformers without doing useful work, increasing losses and reducing capacity.
Frequency (f): The number of complete AC cycles per second, measured in hertz (Hz). Standard frequencies are 50 Hz (used in Europe, Africa, Asia, Australia) and 60 Hz (used in North America, most of Central and South America).
Ohm’s Law
Ohm’s Law is the fundamental relationship between voltage, current, and resistance in a resistive circuit:
V = I x R
Where V is voltage in volts, I is current in amperes, and R is resistance in ohms.
This simple relationship is the basis for almost all electrical circuit analysis. George Simon Ohm published this law in 1827.
Kirchhoff’s Laws
Kirchhoff’s laws are fundamental rules for analyzing electrical circuits:
Kirchhoff’s Current Law (KCL): The sum of all currents entering a node (junction) equals the sum of all currents leaving that node. This is a statement of conservation of charge.
Kirchhoff’s Voltage Law (KVL): The sum of all voltage drops around any closed loop in a circuit equals zero. This is a statement of conservation of energy.
These two laws, combined with Ohm’s Law, allow the complete analysis of any resistive electrical circuit.
21. Advanced Electrical Concepts
Three-Phase Power
Three-phase power uses three alternating currents offset by 120 degrees in phase to deliver continuous, efficient power. It is the standard for industrial and commercial power supply worldwide.
Advantages over single-phase:
- More efficient transmission: For the same power transmitted, three-phase requires less conductor material than single-phase
- Constant power delivery: Three-phase delivers smooth, constant power (individual phase power fluctuates but the sum is constant)
- Simpler motors: Three-phase induction motors are simpler, cheaper, and more reliable than single-phase motors of equivalent power
- Better voltage regulation: Three-phase systems maintain better voltage stability under varying loads
Configurations: Three-phase systems use either delta or star (wye) connections for generators, transformers, and loads. Star connections provide both line voltage (between phases) and phase voltage (between phase and neutral), while delta connections only provide line voltage.
In a star-connected system with phase voltage V, the line voltage is V x sqrt(3) (approximately 1.732 x V). For example, a 230 V phase voltage gives a 400 V line voltage – hence “400/230 V” in European three-phase systems.
Real, Reactive, and Apparent Power (Power Triangle)
In AC circuits with reactive loads (inductors or capacitors), three types of power must be considered:
Real Power (P): Measured in watts (W) or kilowatts (kW). The power that actually does useful work in the circuit. Heats resistors, runs motors, powers lights.
Reactive Power (Q): Measured in volt-amperes reactive (VAR or kVAR). Power that oscillates between the source and reactive components (inductors, capacitors). It does no net useful work but must still be supplied by the generator and carried by the cables.
Apparent Power (S): Measured in volt-amperes (VA or kVA). The vector sum of real and reactive power: S squared = P squared + Q squared. This is what generators, cables, and transformers must be rated for.
Power Factor = P / S = cos(theta)
Where theta is the phase angle between voltage and current.
Improving power factor (by adding capacitor banks to counteract inductive loads) reduces the reactive power that must be supplied, reducing apparent power for the same real power delivered. This improves efficiency and reduces cable and transformer loading.
Capacitors and Inductors in Power Systems
Capacitors in power systems are primarily used for power factor correction (counteracting the inductive reactance of motors and transformers), voltage support in transmission and distribution networks, and filtering harmonics.
Inductors (in the form of transformers, reactors, and motor windings) are ubiquitous in power systems. They store energy in magnetic fields and are central to transformer operation, motor operation, and current-limiting devices.
Inverters and Rectifiers
Inverters convert DC to AC power. They are essential in:
- Solar PV systems (converting DC output of panels to AC grid power)
- Battery storage systems (converting stored DC energy to AC for grid injection)
- Variable frequency drives (converting AC to DC and back to variable-frequency AC to control motor speed)
- Uninterruptible Power Supplies (UPS)
Rectifiers convert AC to DC power. They are used in:
- Battery charging systems
- Power supplies for electronics
- Electrochemical processes (aluminum smelting, electroplating, hydrogen electrolysis)
- HVDC converter stations
Power Electronic Switching Devices: Modern inverters and rectifiers use semiconductor switching devices including Insulated Gate Bipolar Transistors (IGBTs) and increasingly Silicon Carbide (SiC) and Gallium Nitride (GaN) transistors that can switch faster and operate more efficiently at higher temperatures.
Busbars
A busbar is a metallic conductor (typically copper or aluminum) used to distribute current to multiple circuits in a switchgear panel, substation, or distribution board.
Busbars are specified by their current-carrying capacity (related to cross-sectional area and material) and their short-circuit withstand capability (ability to carry fault current without damage for a specified duration).
Protection Relays
Protection relays monitor electrical quantities (current, voltage, frequency, power) and operate circuit breakers to isolate faults rapidly. They are the primary defense mechanism protecting power system equipment.
Types of protection:
- Overcurrent protection: Operates when current exceeds a threshold (faults and overloads)
- Differential protection: Compares current entering and leaving equipment (transformer, generator, busbar)
- Distance protection (impedance protection): Operates based on the measured impedance, used to protect transmission lines
- Earth fault protection: Detects current flowing to earth (ground faults)
- Frequency protection: Operates during under-frequency or over-frequency (grid disturbances)
Modern numerical (digital) protection relays combine multiple protection functions in a single device, with extensive event recording, communications capability, and self-monitoring features.
22. Power Quality
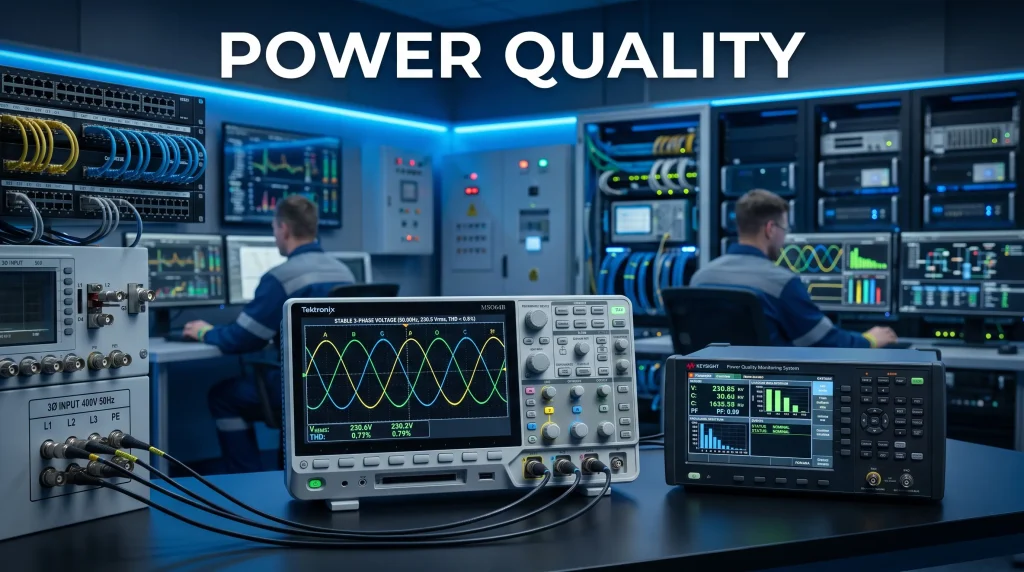
Power quality refers to the stability and cleanliness of the electrical supply: its ability to maintain steady voltage, correct frequency, and a clean sinusoidal waveform.
Poor power quality causes equipment malfunctions, premature failure of electronic components, overheating of motors and transformers, data errors in computing systems, and production losses in manufacturing. The estimated annual cost of poor power quality in the United States alone is approximately $119 billion (EPRI).
Voltage Sags and Swells
Voltage sags (also called voltage dips) are brief reductions in voltage below the nominal level, typically lasting 0.5 cycles to a few seconds. They are caused by faults elsewhere in the network, large motor starting, or arc furnaces. Voltage sags below 90% of nominal can cause process shutdowns, computer crashes, and drive trips.
Voltage swells are brief increases in voltage above nominal. They occur when large loads suddenly disconnect or during single-phase faults. Swells above 110% of nominal can damage sensitive equipment.
Harmonics
Harmonics are voltage and current components at frequencies that are integer multiples of the fundamental frequency (50 or 60 Hz). They are caused by non-linear loads such as variable frequency drives, power supplies, LED lighting, UPS systems, electric arc furnaces, and electronic equipment.
Total Harmonic Distortion (THD) quantifies the total harmonic content as a percentage of the fundamental. IEEE Standard 519 limits voltage THD to 5% at the point of common coupling and limits current harmonic injection from large users.
Harmonics cause transformer and motor overheating, interference with control systems, tripping of power factor correction capacitors, and measurement errors in metering equipment.
Voltage Flicker
Flicker refers to rapid, repetitive variations in voltage causing visible fluctuations in lighting. The main causes are cyclic industrial loads such as arc furnaces, large compressors, and welding equipment.
Mitigation: Static VAR Compensators (SVCs), STATCOMs, active power filters, and proper design of industrial power supplies.
Power Quality Standards
Key international standards governing power quality include:
- IEC 61000 series: International standards for electromagnetic compatibility, including voltage characteristics and flicker limits
- IEEE 519: Recommended practice for limiting harmonic currents in power systems
- EN 50160: European standard defining voltage characteristics of public electricity supply
- ITIC (CBEMA) curve: Defines equipment voltage tolerance over time
23. Oil and Gas Industry: Upstream, Midstream, Downstream
The oil and gas industry is one of the world’s largest, with global revenues exceeding $4 trillion annually in recent years. It is organized into three distinct segments based on activities and geography.
Upstream
Upstream refers to exploration and production (E&P): finding oil and gas reserves and extracting them from the ground.
Activities include:
- Geological surveys and seismic data acquisition
- Exploratory drilling (wildcatting)
- Appraisal drilling to assess reservoir size
- Development drilling (production wells)
- Well completion and production
- Reservoir management over the field’s productive life
Upstream is the most capital-intensive and technically challenging segment, with high risk (many exploratory wells find no commercially viable hydrocarbons) but potentially high reward.
Key metrics:
- Recovery factor: Percentage of hydrocarbons in a reservoir that can be economically extracted. Typically 20 to 50% for conventional oil fields.
- Production decline rate: How fast a field’s production falls over time without additional wells or recovery techniques
- Lifting cost (operating cost per barrel): Varies enormously from under $5 per barrel in some Middle East fields to over $40 per barrel in deepwater or Arctic operations
Midstream
Midstream covers the transportation, storage, and wholesale marketing of crude oil, natural gas, and refined products.
Activities include:
- Pipeline transportation (crude oil, natural gas, refined products)
- LNG liquefaction, transportation, and regasification
- Gas processing and natural gas liquids (NGLs) extraction
- Crude oil and refined product storage terminals
- Tanker shipping
- Pipeline operations and maintenance
Midstream assets are typically more stable businesses than upstream, with revenue often tied to long-term contracts (tariffs) rather than commodity prices. Global pipeline network length exceeds 2 million kilometers (CIA World Factbook).
Downstream
Downstream covers refining crude oil into usable products and distributing them to consumers.
Activities include:
- Crude oil distillation and refining
- Production of fuels (gasoline, diesel, jet fuel, fuel oil, LPG)
- Production of petrochemical feedstocks (ethylene, propylene, benzene)
- Retail fuel stations and fuel distribution
- Marketing and trading of petroleum products
The global refining capacity is approximately 100 million barrels per day (mb/d), with the U.S., China, Russia, and India having the largest capacities.
| Product | Typical Yield from Crude Oil | Main Uses |
|---|---|---|
| Gasoline | 43 to 46% | Passenger vehicles |
| Distillate fuel oil (diesel, heating oil) | 26 to 29% | Trucks, buses, heating |
| Kerosene (jet fuel) | 7 to 9% | Aviation |
| LPG (propane, butane) | 4 to 5% | Heating, cooking, vehicle fuel |
| Residual fuel oil | 5 to 8% | Ships, power generation |
| Other products | remaining | Asphalt, lubricants, petrochemical feedstocks |
24. Oil and Gas Operations and Technologies
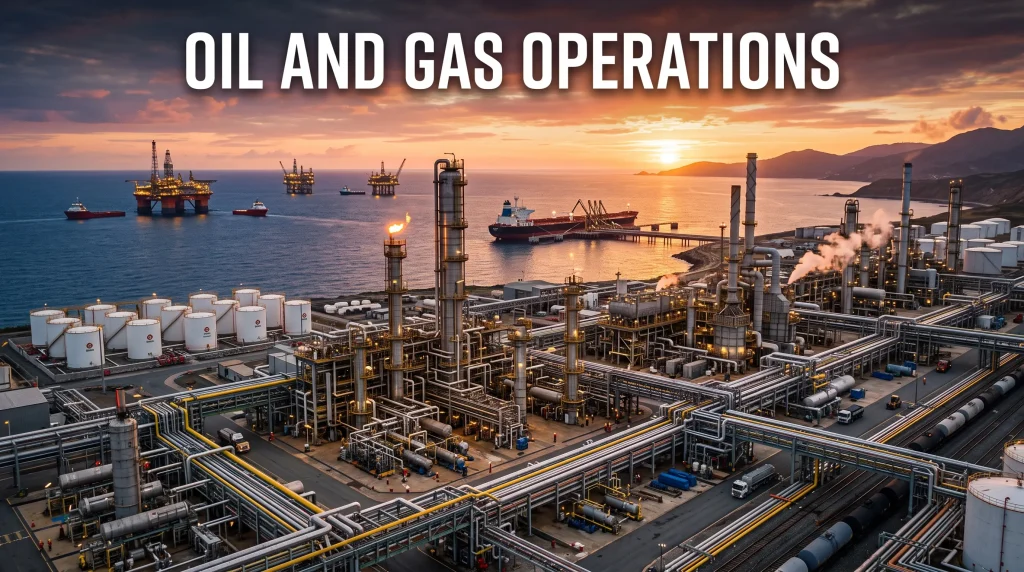
Oil Exploration
Finding hydrocarbons requires sophisticated geological and geophysical methods.
Geological surveys analyze surface rock formations, ancient sedimentary environments, and structural features that suggest subsurface hydrocarbon traps.
Seismic surveys are the primary tool for mapping subsurface geology. Sound waves are generated at the surface (by explosive charges or vibrator trucks onshore; by air guns towed by vessels offshore) and reflected back from underground rock layers. 3D seismic produces detailed three-dimensional images of subsurface formations. 4D seismic (repeated 3D surveys over time) monitors reservoir changes during production.
Modern seismic data processing uses advanced computing and increasingly machine learning algorithms to interpret large datasets and identify drilling targets.
Drilling Technologies
Rotary drilling is the standard method: a rotating drill bit (typically tri-cone rock bits or Polycrystalline Diamond Compact (PDC) bits) cuts through rock. The drill string (steel pipe) extends from the surface to the bit, transmitting rotation and pressure.
Drilling fluid (mud): A specially formulated fluid pumped through the drill string and up the annulus (space between drill string and borehole). It cools and lubricates the bit, carries rock cuttings to the surface, and maintains wellbore pressure to prevent blowouts.
Directional and horizontal drilling: Modern drills can change direction underground, enabling:
- Access to multiple reservoir targets from a single surface location (reducing environmental footprint)
- Horizontal drilling through reservoir formations, dramatically increasing the contact area between the wellbore and the reservoir (essential for shale production)
Drilling rig types:
- Land rigs: Mobile or truck-mounted units for onshore drilling. Range from small workover rigs to massive mechanical, electric, or SCR rigs for deep wells.
- Jack-up rigs: Mobile offshore units with extendable legs. Used in shallow water (up to ~150 meters). The world’s jackup rig fleet numbers approximately 500 units.
- Semi-submersible rigs: Floating platforms with submerged pontoons stabilizing against waves. Used in water depths of 150 to 3,000+ meters.
- Drillships: Self-propelled vessels equipped for drilling. Used in ultra-deepwater (2,000 to 3,600+ meters). Can drill in locations inaccessible to semi-submersibles.
Well Completion
After drilling, a well is completed to enable safe, controlled hydrocarbon production.
Steps:
- Casing installation: Steel pipes cemented in the wellbore to prevent collapse and isolate different geological zones
- Perforation: Shaped charges create holes through the casing and cement into the reservoir rock, allowing hydrocarbons to flow
- Stimulation: Hydraulic fracturing or acid stimulation to improve reservoir connectivity
- Wellhead and Christmas tree installation: Surface equipment controlling production flow
Christmas tree: The assembly of valves, gauges, and chokes at the wellhead that controls production flow. The name comes from the branching arrangement of valves. Subsea Christmas trees are installed on the seafloor for deepwater wells.
Enhanced Oil Recovery (EOR)
EOR techniques increase recovery beyond what natural reservoir pressure and primary/secondary methods can achieve.
Primary recovery: Natural reservoir pressure drives hydrocarbons to the wellbore. Typically recovers 5 to 15% of original oil in place (OOIP).
Secondary recovery (water flooding): Water is injected to maintain pressure and sweep oil toward production wells. Increases recovery to 15 to 40% OOIP.
Tertiary recovery (EOR):
- Steam injection (thermal EOR): Used in heavy oil fields. Steam reduces oil viscosity, improving flow.
- CO2 injection (gas EOR): CO2 dissolves in oil, swelling it and reducing viscosity. Also permanently stores CO2 in the reservoir.
- Chemical flooding: Surfactants, polymers, and alkalis improve sweep efficiency and reduce interfacial tension.
EOR methods currently account for approximately 3 mb/d of global oil production (IEA).
LNG Technology
Liquefaction process: Natural gas is cooled to approximately -162 degrees Celsius at LNG liquefaction plants (also called LNG trains). Multiple refrigeration cycles are used, typically using refrigerants such as propane and mixed refrigerants. The world’s largest LNG trains have capacity of approximately 9 million tonnes per year (mtpa).
LNG carriers: Specialized double-hulled vessels with insulated tanks made of Invar (a nickel-iron alloy) or similar materials, maintaining LNG at cryogenic temperatures. The largest LNG carriers (Q-Flex and Q-Max classes) can carry over 260,000 cubic meters of LNG, equivalent to approximately 160 billion BTU of energy.
Regasification: At the receiving terminal, LNG is warmed and converted back to gas for pipeline delivery. Floating Storage and Regasification Units (FSRUs) allow rapid deployment of import capacity without building shore-based terminals.
FPSO (Floating Production Storage and Offloading)
An FPSO is a floating vessel used to process and store hydrocarbons from offshore fields before transferring them to shuttle tankers. FPSOs are used where permanent pipelines to shore are not economical.
Modern FPSOs are among the world’s largest and most complex engineering structures, capable of processing hundreds of thousands of barrels of oil per day and storing millions of barrels. The Prelude FLNG (Floating Liquefied Natural Gas) facility operated by Shell in Australia is the world’s largest floating structure ever built at 488 meters in length.
Petrochemicals
Petrochemicals are chemicals derived from petroleum or natural gas, serving as the raw materials for plastics, synthetic fibers, fertilizers, pharmaceuticals, and countless other products.
Key petrochemical base products:
- Ethylene: Made by steam cracking of naphtha or ethane. Used to make polyethylene (the world’s most produced plastic), PVC, and many other products.
- Propylene: Co-product of ethylene production. Used for polypropylene, acrylics, and fibers.
- BTX (Benzene, Toluene, Xylene): Aromatic compounds used in fuels (octane boosters) and as feedstocks for plastics, fibers, and chemicals.
- Methanol: Made from natural gas (via syngas). Used as a fuel, solvent, and feedstock for formaldehyde and other chemicals.
- Ammonia: Made from nitrogen and hydrogen (from natural gas). The primary feedstock for nitrogen fertilizers, without which global food production could not support current population levels.
Global petrochemical revenues exceed $600 billion annually. The petrochemical sector is expected to become the largest driver of oil demand growth by 2030 as transportation demand declines due to EVs.
25. Electrical Safety in Energy Work
Electrical safety is a critical discipline for anyone working with or near electrical systems. Electricity can cause fatal shocks, severe burns, fires, and explosions. The energy sector has developed extensive safety practices and standards to protect workers.
Arc Flash
An arc flash is a sudden, violent release of electrical energy caused by an arcing fault (current flowing through ionized air between conductors). Arc flash events produce:
- Temperatures up to 35,000 degrees Fahrenheit at the arc point (approximately 4 times the surface temperature of the sun)
- A pressure wave (arc blast) that can reach thousands of pounds per square foot
- Intense ultraviolet and infrared radiation causing eye damage and skin burns
- Molten metal droplets and vaporized copper
Arc flash incidents cause approximately 5 to 10 fatalities and 2,000 hospitalizations per year in the U.S. alone (ESFI).
Arc flash risk assessment (per NFPA 70E standard) calculates the Incident Energy at each potential work location, expressed in calories per square centimeter (cal/cm squared). This determines the PPE category required for safe work.
Lockout Tagout (LOTO)
Lockout Tagout is a safety procedure that ensures all energy sources (electrical, mechanical, hydraulic, pneumatic, thermal, chemical) are isolated and cannot be accidentally re-energized before maintenance or repair work begins.
LOTO procedure steps:
- Notify affected employees
- Identify all energy sources for the equipment
- Shut down the equipment
- Isolate all energy sources (open circuit breakers, close valves)
- Lock each energy isolation device with a personal padlock
- Tag each lockout device with warning information
- Release stored energy (bleed pressure, discharge capacitors, block gravity-actuated parts)
- Verify the equipment is de-energized by testing
OSHA 29 CFR 1910.147 governs lockout tagout in the United States. Violations of LOTO procedures are among the top causes of serious workplace injuries in industrial settings.
Personal Protective Equipment (PPE) for Electrical Work
Electrical PPE is selected based on the specific hazards present:
| Hazard | PPE Required |
|---|---|
| Arc flash (low energy) | Arc-rated (AR) clothing: minimum 4 cal/cm squared rating, face shield |
| Arc flash (high energy) | AR clothing: 8 to 40+ cal/cm squared, arc flash hood, AR gloves |
| Shock hazard (low voltage) | Insulated gloves (rubber insulating gloves with leather protectors), insulated tools |
| Shock hazard (high voltage) | Insulated gloves rated for working voltage, insulated blankets, insulated line hoses |
| Electrical work general | Safety glasses, hard hat (Class E for electrical), non-conductive footwear |
Rubber insulating gloves must be tested every 6 months per ASTM F496 to ensure they have not developed cracks or pinholes that would compromise their insulating properties.
NFPA 70E Standard
NFPA 70E is the standard for Electrical Safety in the Workplace, published by the National Fire Protection Association. It provides guidance on:
- Arc flash risk assessment and labeling
- Personal protective equipment requirements
- Safe work practices around energized electrical equipment
- Establishing arc flash boundaries (limited, restricted, and prohibited approach)
- Energized electrical work permits
Key Electrical Safety Principles
Treat all conductors as live: Never assume a circuit is de-energized without verifying with a calibrated test instrument.
Use the right tools: Insulated tools rated for the working voltage prevent accidental contact.
Maintain safe distances: NFPA 70E defines minimum approach distances for different voltage levels.
Work with a buddy: Never work alone on energized equipment.
Follow documented procedures: All electrical work on live equipment should follow written, reviewed procedures.
26. Energy Storage Technologies
Energy storage is one of the most critical enabling technologies for the energy transition. Storage allows energy generated at one time (e.g., solar energy at midday) to be used at a different time (e.g., evening demand peak), effectively decoupling generation from consumption.
The global energy storage market installed approximately 45 GW / 100 GWh of new capacity in 2023, a record, with utility-scale battery storage driving most of the growth (BloombergNEF).
Battery Energy Storage Systems (BESS)
Battery storage stores electrical energy in chemical form within rechargeable electrochemical cells. BESS applications range from residential systems (5 to 30 kWh) to utility-scale installations (hundreds of MWh).
Applications:
- Grid frequency regulation: Batteries respond in milliseconds to frequency deviations
- Peak shaving: Charging during off-peak hours and discharging during peak demand
- Renewable energy time-shifting: Storing excess solar or wind for use when generation is low
- Backup power: Providing power during outages
- Capacity firming: Smoothing the variable output of renewable plants
World’s largest battery storage systems (as of 2024):
- Moss Landing Energy Storage Facility (California): 1,200 MWh (Vistra Energy)
- Victoria Big Battery (Australia): 450 MWh (Neoen/Tesla)
- Multiple large systems under construction in the U.S., Australia, and Europe will exceed these
Lithium-Ion Batteries
Lithium-ion batteries are the dominant electrochemical storage technology for both EVs and stationary storage.
How they work: Lithium ions move through an electrolyte from anode to cathode during charging, reversing during discharge. The anode is typically graphite, and cathodes use lithium metal oxides (LFP, NMC, NCA, etc.).
Common Li-ion chemistries for energy storage:
| Chemistry | Full Name | Energy Density | Cycle Life | Safety | Main Use |
|---|---|---|---|---|---|
| LFP | Lithium Iron Phosphate | Moderate (120 to 160 Wh/kg) | Very high (3,000+ cycles) | Excellent (no thermal runaway) | Grid storage, some EVs |
| NMC | Lithium Nickel Manganese Cobalt Oxide | High (150 to 250 Wh/kg) | High (1,000 to 2,000 cycles) | Good | EVs, electronics |
| NCA | Lithium Nickel Cobalt Aluminum Oxide | High (200 to 260 Wh/kg) | High (1,000+ cycles) | Good | EVs (Tesla) |
| LTO | Lithium Titanate Oxide | Low (50 to 80 Wh/kg) | Very high (10,000+ cycles) | Excellent | Fast-cycling applications |
Cost trends: Utility-scale lithium-ion battery pack costs fell from approximately $1,200/kWh in 2010 to under $140/kWh in 2023 (BloombergNEF), an 89% reduction. Battery costs are projected to fall below $80/kWh by 2030.
Pumped Hydro Storage
Pumped hydro storage (PHS) uses excess electricity to pump water from a lower reservoir to an upper reservoir. When power is needed, water flows back down through turbines to generate electricity.
Key statistics:
- Over 90% of global installed grid storage capacity (by energy) (IEA)
- Global installed capacity: approximately 160 GW (IRENA)
- Round-trip efficiency: 70 to 85%
- Discharge duration: Hours to days
- Lifespan: 50 to 100+ years
Constraints: Pumped hydro requires specific topographical conditions (elevation differences, available water, suitable geology for reservoirs). Underground pumped hydro (using abandoned mines or purpose-built underground caverns) could expand the technology to flatter regions.
Hydrogen Energy Storage
Hydrogen can serve as a long-duration energy storage medium. Excess renewable electricity powers electrolyzers to produce green hydrogen, which can be stored and later converted back to electricity via fuel cells or gas turbines.
Characteristics:
- Long-duration / seasonal storage: Unlike batteries (hours), hydrogen can store energy for months
- High energy density by mass (33 kWh/kg) but very low density by volume (0.9 Wh/L at atmospheric pressure, requiring compression to 350 to 700 bar for practical storage)
- Round-trip efficiency: Currently 30 to 45% (electrolysis + fuel cell), significantly lower than batteries
Storage methods:
- Compressed hydrogen: Standard approach at 350 to 700 bar in tanks
- Liquid hydrogen: Cooled to -253 degrees Celsius (near absolute zero), reduces volume but requires energy for liquefaction
- Solid-state hydrogen storage: Metal hydrides absorb hydrogen; safer and more compact than compressed gas but currently heavy and expensive
- Underground storage: Natural caverns, depleted gas fields, or salt caverns. The UK, Germany, and the U.S. are developing large-scale underground hydrogen storage.
Flow Batteries
Flow batteries store energy in liquid electrolytes contained in external tanks. Unlike conventional batteries, the power capacity (determined by cell stack size) and energy capacity (determined by tank volume) can be scaled independently.
Types:
- Vanadium Redox Flow Batteries (VRFB): The most mature technology, using vanadium in different oxidation states in both electrolyte tanks. Cycle life of 10,000+ cycles with minimal capacity degradation.
- Zinc-bromine flow batteries
- Iron-based flow batteries (emerging lower-cost option)
Flow batteries are well suited for 4 to 12 hour discharge duration applications, making them attractive for daily grid storage. Their main disadvantages are lower energy density and higher upfront cost compared to lithium-ion.
Flywheel Energy Storage
Flywheels store energy as rotational kinetic energy in a spinning mass (rotor). Modern flywheels use advanced composite materials (carbon fiber) spinning at 20,000 to 60,000 RPM in a vacuum enclosure with magnetic bearings to minimize friction losses.
Characteristics:
- Response time: Milliseconds (fastest of any storage technology)
- Power density: Very high
- Duration: Seconds to minutes (short-duration, high-power)
- Cycle life: Effectively unlimited (no electrochemical degradation)
- Main application: Frequency regulation, bridging short power interruptions, UPS systems
Compressed Air Energy Storage (CAES)
CAES stores energy by compressing air into underground geological formations (salt caverns, depleted mines) or large pressure vessels during periods of excess power. Air is released and expanded through turbines (often with supplemental gas heat) when power is needed.
Existing projects:
- McIntosh, Alabama, USA: 110 MW, operational since 1991
- Huntorf, Germany: 320 MW, operational since 1978 (world’s first CAES plant)
Advanced CAES (ACAES or Adiabatic CAES): Captures heat generated during compression and uses it to reheat the air during expansion, improving round-trip efficiency from approximately 42 to 54% to potentially 60 to 70% without needing supplemental gas.
Thermal Energy Storage
Thermal storage stores heat or cold for later use, rather than storing electricity directly.
Molten salt thermal storage: CSP plants heat molten salts (typically a mixture of sodium and potassium nitrate) to 290 to 560 degrees Celsius. This heat can be stored in insulated tanks for 6 to 15 hours and used to generate steam and electricity when solar radiation is insufficient.
Ice storage: Chilled water or ice is produced at night using cheap off-peak electricity and used during the day for air conditioning. Buildings using ice storage can shift up to 90% of their cooling load to off-peak hours.
Heat batteries: Phase-change materials (PCMs) that absorb or release heat during melting/solidification are used in building thermal management and industrial processes.
Gravity-Based Storage
Several companies are developing gravity storage systems that raise heavy weights (concrete blocks, rail cars, mine shaft weights) using excess electricity and lower them to generate power.
Examples:
- Energy Vault (Switzerland/U.S.): Uses cranes to stack and unstack large concrete blocks
- Gravitricity (UK): Lowers heavy weights in mine shafts
These systems offer geographic flexibility compared to pumped hydro and potentially long system lifespans with minimal degradation.
Demand Response
Demand response (DR) is not technically storage, but it functions similarly by shifting electricity consumption to match grid conditions.
How it works: Large electricity consumers (industrial factories, commercial buildings, data centers, EV fleet operators) agree to reduce or shift their consumption when the grid is stressed or when renewable generation exceeds demand. In return, they receive payments or reduced electricity tariffs.
Scale: The IEA estimates global demand response capacity could provide the equivalent of 500 GW of flexible capacity by 2030, comparable to the entire electricity demand of Europe.
Types:
- Emergency demand response: Voluntary curtailment during grid emergencies
- Economic demand response: Responding to real-time or time-of-use price signals
- Automated demand response (ADR): Automated systems that respond to utility signals without human intervention
27. Energy Efficiency and Conservation
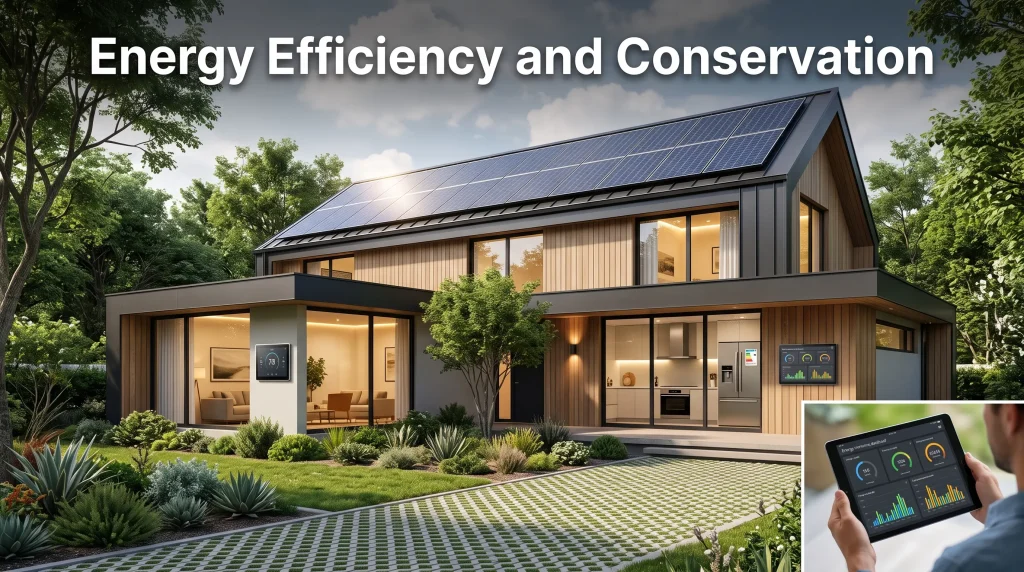
Energy efficiency and conservation are among the most cost-effective strategies for reducing energy costs, carbon emissions, and import dependence.
The IEA calls energy efficiency the “first fuel” of the clean energy transition. The IEA’s Sustainable Development Scenario requires energy intensity improvements of 4% per year to 2030, compared to approximately 2% achieved in recent years.
Energy Efficiency vs Energy Conservation
Energy efficiency means achieving the same output (heating a building, producing steel, running a motor) using less energy input. Examples: replacing a 60-watt incandescent bulb with a 9-watt LED that produces the same light output; upgrading a factory motor from 85% to 95% efficiency.
Energy conservation means reducing overall energy consumption, potentially by using less or changing behavior. Examples: turning off lights when leaving a room, reducing thermostat settings, driving fewer miles.
Both approaches are complementary and necessary.
Building Energy Efficiency
Buildings account for approximately 30% of global energy consumption and 26% of global energy-related emissions (IEA). Improving building efficiency is one of the largest available efficiency opportunities.
Key technologies:
- Insulation: Reducing heat loss through walls, roofs, and floors
- High-performance windows: Double and triple glazing with low-emissivity coatings
- LED lighting: LEDs use 75 to 90% less energy than incandescent bulbs and last 15 to 25 times longer
- Heat pumps: Transfer heat rather than generating it by combustion, achieving efficiencies (Coefficient of Performance, COP) of 2 to 5 – meaning they deliver 2 to 5 units of heat for every 1 unit of electricity consumed
- Building automation systems (BAS): Automated control of HVAC, lighting, and other systems based on occupancy, weather, and time-of-day
- Smart meters and energy management: Real-time visibility into consumption patterns
Building performance standards: The EU’s Energy Performance of Buildings Directive (EPBD) requires all new buildings to be nearly zero-energy by 2030 and all existing buildings to be renovated to nearly zero-energy by 2050.
HVAC Efficiency
Heating, Ventilation, and Air Conditioning (HVAC) accounts for approximately 40 to 50% of energy consumption in commercial buildings and 50 to 70% in residential buildings in many climates.
Key efficiency metrics:
- SEER (Seasonal Energy Efficiency Ratio): Used for air conditioners. Higher is better (modern standards require SEER 14 to 15; premium units achieve SEER 20+).
- AFUE (Annual Fuel Utilization Efficiency): Used for gas furnaces. Modern condensing furnaces achieve AFUE 95 to 98%.
- COP (Coefficient of Performance): Used for heat pumps. A COP of 3 means 3 units of heat for every 1 unit of electricity.
Heat pumps are increasingly recognized as the most efficient heating technology for most climates. Modern cold-climate heat pumps can operate effectively at outdoor temperatures as low as -25 to -30 degrees Celsius.
Industrial Energy Efficiency
Industry accounts for approximately 37% of global energy consumption (IEA). Major opportunities include:
Variable Speed Drives (VSDs): Adjusting motor speed to actual demand rather than running at full speed and throttling. Motors consume approximately 43% of global electricity (IEA). VSDs can reduce motor energy use by 30 to 50% in many applications such as pumps and fans.
Waste heat recovery: Capturing heat from industrial processes (furnaces, compressors, cooling water) and using it for heating, steam generation, or electricity production (via Organic Rankine Cycle, ORC, systems).
Process optimization: Advanced process control, real-time monitoring, and AI-driven optimization reduce energy waste while maintaining or improving output.
Material efficiency: Using less material per unit of product (design for weight reduction, recycling) reduces embodied energy.
Energy Auditing
An energy audit is a systematic assessment of energy use in a facility to identify and prioritize opportunities for improvement.
Levels of audit (ASHRAE standard):
- Level 1 (Walk-Through Audit): Brief visual inspection identifying obvious opportunities and providing rough cost estimates
- Level 2 (Energy Survey and Analysis): Detailed analysis of energy bills, equipment inventories, and operating schedules, with cost-benefit analysis of improvements
- Level 3 (Investment-Grade Audit): Detailed engineering-level analysis supporting major capital investments
Certified Energy Managers (CEM) are credentialed by the Association of Energy Engineers (AEE) and provide professional energy auditing services.
ISO 50001 Energy Management Standard
ISO 50001 is an international standard providing a framework for organizations to establish, implement, maintain, and improve an Energy Management System (EnMS).
It follows the Plan-Do-Check-Act (PDCA) cycle and requires:
- Setting energy objectives and targets
- Measuring and monitoring energy performance indicators
- Conducting energy reviews and audits
- Implementing improvement projects
Over 30,000 organizations in over 180 countries are certified to ISO 50001 (ISO Survey, 2022).
Smart Buildings and Advanced Metering Infrastructure
Smart buildings use integrated sensor networks, automation systems, and data analytics to optimize energy use in real time. Systems include:
- Building Energy Management Systems (BEMS): Central platforms monitoring and controlling all building energy systems
- IoT sensors: Temperature, CO2, occupancy, light level sensors informing automated control decisions
- Predictive control: Using weather forecasts and occupancy patterns to pre-heat or pre-cool buildings during low-cost periods
Advanced Metering Infrastructure (AMI): Smart meters communicate detailed consumption data (often in 15-minute intervals) to utilities. This enables:
- Time-of-use pricing (charging more during peak hours)
- Demand response programs
- Outage detection and restoration management
- Customer energy management tools
28. Environmental Impact of Energy
Carbon Emissions and Climate Change
The energy sector is the largest source of global greenhouse gas (GHG) emissions. According to the IEA, energy-related CO2 emissions reached approximately 37 billion tonnes (Gt) in 2023, a new record.
Sources of energy-related CO2 emissions (2022, IEA):
- Electricity and heat generation: 43%
- Transport: 26%
- Industry (direct fuel combustion): 18%
- Buildings (direct fuel use): 9%
- Other: 4%
Climate impacts: The Intergovernmental Panel on Climate Change (IPCC) Sixth Assessment Report (AR6) found that global surface temperature has increased by approximately 1.1 degrees Celsius above pre-industrial levels (1850 to 1900 average) by 2011 to 2020. At the current rate of emissions, the world is on track for 2.5 to 3 degrees Celsius of warming by 2100, with severe consequences for sea levels, extreme weather events, ecosystems, agriculture, and human health.
Carbon Footprint of Different Energy Sources
The lifecycle carbon intensity (gCO2eq per kWh) varies enormously across energy sources:
| Energy Source | Median Lifecycle Emissions (gCO2eq/kWh) |
|---|---|
| Coal (black) | 820 |
| Coal (brown/lignite) | 1,050 |
| Natural gas (CCGT) | 490 |
| Oil (diesel) | 650 |
| Nuclear | 12 |
| Onshore wind | 11 |
| Offshore wind | 12 |
| Solar PV (utility) | 48 |
| Concentrated Solar Power | 22 |
| Hydropower | 24 |
| Biomass (sustainable) | 230 |
| Geothermal | 38 |
*Source: IPCC AR5 Working Group III, Annex III Technology-specific Cost and Performance Parameters*
These lifecycle figures include emissions from construction, fuel extraction, operation, and decommissioning. The comparison dramatically illustrates why the energy transition is central to addressing climate change.
Net Zero and Carbon Neutrality
Net zero is a state where anthropogenic GHG emissions are balanced by removals of CO2 from the atmosphere over a given period.
Carbon neutrality (sometimes used synonymously) typically refers to an entity or country balancing its residual emissions through carbon offsets.
Achieving net zero requires:
- Eliminating the majority of emissions through clean energy, electrification, efficiency, and sustainable land use
- Removing remaining residual emissions through nature-based solutions (reforestation, soil carbon) and technological solutions (Direct Air Capture, Bioenergy with Carbon Capture and Storage)
Country net zero targets:
- UK: Net zero by 2050 (legally binding)
- EU: Climate neutrality by 2050 (legally binding)
- China: Carbon neutrality by 2060
- India: Net zero by 2070
- Saudi Arabia: Net zero by 2060
Carbon Capture, Utilization, and Storage (CCUS)
CCUS technologies capture CO2 from emission sources or from the atmosphere and either store it permanently underground or utilize it as a feedstock.
Post-combustion capture: CO2 is separated from flue gases after combustion using chemical solvents (typically amine solutions), physical solvents, or membranes.
Pre-combustion capture: Fuel is converted to hydrogen and CO2 before combustion. CO2 is captured and hydrogen is burned cleanly.
Oxy-fuel combustion: Fuel is burned in pure oxygen rather than air, producing a flue gas consisting primarily of CO2 and water vapor, making CO2 capture simpler.
Direct Air Capture (DAC): Large fans draw ambient air through chemical sorbents that capture CO2 directly from the atmosphere. Very energy-intensive but can remove legacy CO2 from any location. Costs are currently $300 to $1,000+ per tonne of CO2 but projected to fall with scale.
Current CCUS scale: As of 2023, approximately 45 Mt CO2 per year of capture capacity is operational or under construction globally (IEA). The IEA’s Net Zero Scenario requires CCUS to capture approximately 4,000 Mt CO2 per year by 2050, indicating the massive scale-up needed.
Environmental Impacts of Different Energy Sources
Air pollution: Fossil fuel combustion releases sulfur dioxide (SO2), nitrogen oxides (NOx), particulate matter (PM2.5 and PM10), mercury, and volatile organic compounds. The World Health Organization estimates that 7 million premature deaths per year are linked to air pollution, the vast majority of which is caused by fossil fuel combustion.
Water use: Power plants require significant water for cooling. Thermoelectric power plants (coal, nuclear, gas) withdraw approximately 190 billion gallons of water per day in the U.S. alone (USGS). Solar PV and wind require minimal water during operation.
Land use: Solar and wind farms require significant land area but can often be co-located with agriculture (agrivoltaics). Oil and gas development can have significant land use impacts from access roads, well pads, and pipelines.
Biodiversity: Energy infrastructure can impact wildlife habitats. Hydroelectric dams disrupt river ecosystems and fish migration. Wind turbines cause bird and bat mortality (though far less than buildings, vehicles, and cats). Solar farms can be designed with wildlife-friendly features.
Environmental, Social, and Governance (ESG)
ESG criteria are used by investors, regulators, and companies to assess sustainability and ethical performance.
Environmental (E): Carbon emissions and climate risk, energy efficiency, water use, biodiversity impact, waste management, pollution prevention
Social (S): Worker safety and health, labor practices, community relations, energy access and equity, supply chain standards, human rights
Governance (G): Board independence and diversity, executive compensation alignment with sustainability, transparency and disclosure, anti-corruption, shareholder rights
ESG investing: Global assets under management using ESG criteria exceeded $40 trillion in 2022 (Bloomberg Intelligence) and continue to grow as investors increasingly recognize climate risk as financial risk. Major energy companies face growing pressure from investors to align their business models with net zero pathways.
29. Sustainability and Green Energy Transition
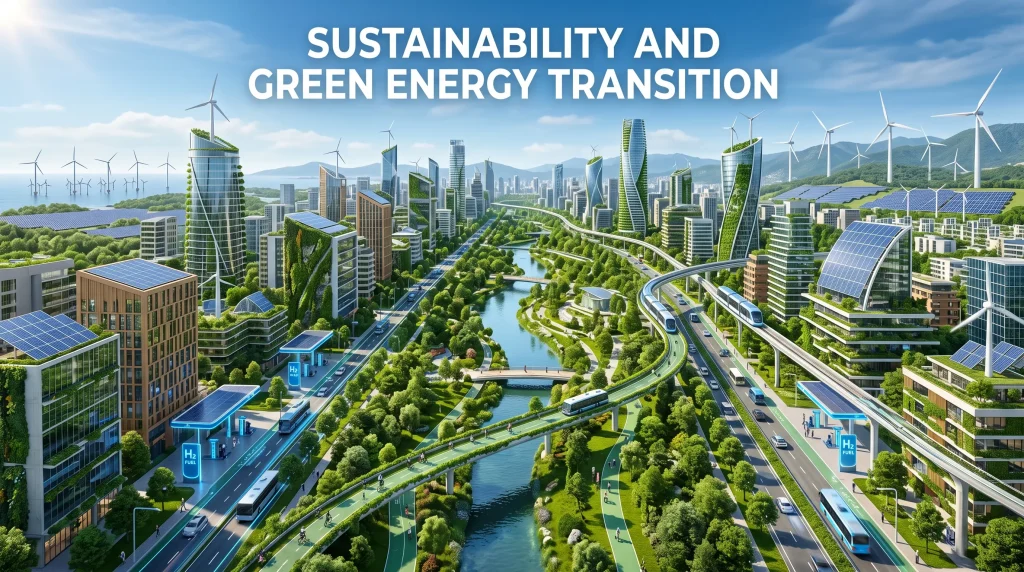
The Energy Transition
The global energy transition refers to the shift from a fossil fuel-dominated energy system to one primarily powered by clean energy sources. It is driven by three interconnected imperatives:
- Climate: Avoiding catastrophic climate change by reducing GHG emissions to net zero
- Economics: Rapidly falling costs making clean energy increasingly competitive with fossil fuels
- Technology: Advances in renewable energy, batteries, electrification, and hydrogen making the transition technically feasible
Scale and pace: The IEA’s Net Zero by 2050 (NZE) scenario requires:
- No new fossil fuel development (oil, gas, or coal) beyond what is already approved (from 2021)
- 90% of global electricity from renewables by 2050
- 60% of new car sales to be electric by 2030
- Over $4 trillion in annual clean energy investment by 2030
Current trajectory: Global clean energy investment reached approximately $1.8 trillion in 2023 (IEA), already exceeding fossil fuel investment. But to meet net zero targets, this must more than double by 2030.
Decarbonization Pathways by Sector
Power sector: Replacing fossil fuel power plants with renewables is the most advanced part of the transition. Renewables are now the cheapest source of new electricity in most of the world, and their deployment is accelerating.
Transport: Electrification of road transport is underway, with EVs approaching cost parity with internal combustion vehicles in many segments. Aviation and shipping are harder to electrify and may rely on hydrogen, ammonia, or sustainable fuels.
Buildings: Electrification of heating (heat pumps replacing gas boilers) and cooking, combined with efficiency improvements, is the primary pathway.
Industry: The most challenging sector. Steel, cement, aluminum, and chemicals are difficult to decarbonize because of process emissions (not just combustion) or requirement for very high temperatures. Hydrogen, electrification, and CCUS are all needed.
Agriculture: Methane from livestock and nitrous oxide from fertilizers are significant sources not easily addressed by energy transition alone.
Renewable Portfolio Standards (RPS)
Renewable Portfolio Standards (also called Renewable Energy Standards or Renewable Obligation in the UK) are regulations requiring utilities to source a minimum percentage of electricity from renewable sources.
Examples:
- California (U.S.): 100% clean electricity by 2045
- EU: 42.5% renewables by 2030 (Renewable Energy Directive III)
- UK: 95% zero-carbon electricity by 2030
- Australia: State-level targets ranging from 50% to 100% renewables by 2030
Circular Economy in Energy
The circular economy applies to energy systems and equipment, aiming to design out waste and keep materials in use.
Solar panels: Most current solar panels are not fully recyclable at end of life. A growing industry for solar panel recycling is developing. The EU Solar Panel Recycling Initiative is building infrastructure to recover silicon, glass, silver, and aluminum from end-of-life panels.
Wind turbine blades: Fiberglass and carbon fiber blades are difficult to recycle. Companies like Siemens Gamesa are developing recyclable blade materials and thermoplastic resin systems that can be chemically recycled.
Batteries: Lithium-ion battery recycling recovers lithium, cobalt, nickel, and manganese. Companies including Redwood Materials, Li-Cycle, and Umicore are scaling battery recycling capacity. Regulations in the EU mandate battery recycling and require minimum recycled content.
Carbon Pricing and Carbon Markets
Carbon pricing creates an economic incentive to reduce emissions by assigning a cost to CO2 emissions.
Carbon taxes: Governments directly charge emitters a set price per tonne of CO2. Examples: Canada ($65 CAD/tonne in 2023, rising to $170 CAD by 2030), Sweden (approximately $130 USD/tonne), UK (Emissions Trading Scheme).
Cap-and-trade (emissions trading): A total emissions cap is set, allowances are distributed or auctioned, and companies can trade them. Companies that reduce emissions below their allowance can sell excess allowances to companies that need more.
EU Emissions Trading System (ETS): The world’s largest carbon market, covering approximately 40% of EU GHG emissions. Carbon prices in the EU ETS ranged from approximately 20 to 100 euros per tonne of CO2 during 2021 to 2023.
Carbon border adjustment mechanism (CBAM): The EU’s CBAM (fully operational from 2026) applies a carbon price to imports of carbon-intensive goods (steel, cement, aluminum, fertilizers, electricity) from countries without equivalent carbon pricing. This addresses carbon leakage and levels the playing field for EU producers.
The Paris Agreement
The Paris Agreement is an international climate treaty adopted in December 2015 at COP21. Nearly all countries (195 parties as of 2023) have ratified it.
Key provisions:
- Limiting global temperature rise to well below 2 degrees Celsius above pre-industrial levels, with efforts toward 1.5 degrees Celsius
- Countries submit Nationally Determined Contributions (NDCs): national climate action plans that must be updated every 5 years with increasing ambition
- Developed countries commit to providing $100 billion per year in climate finance to developing nations
Current status: Current NDCs are insufficient to meet the 1.5 degrees Celsius goal. The IPCC warns that on current policies, warming of 2.7 degrees Celsius is projected by 2100.
Just Energy Transition
A just energy transition recognizes that the shift from fossil fuels can create economic hardship for workers and communities heavily dependent on fossil fuel industries, and aims to ensure this transition is equitable and inclusive.
Key elements:
- Retraining and employment support for workers in coal mining, oil refining, and related industries
- Economic diversification for fossil fuel-dependent communities
- Ensuring clean energy benefits (lower bills, cleaner air) are shared equitably
- Providing energy access to the 733 million people globally still without electricity
Examples: The EU’s Just Transition Fund allocates over €17.5 billion specifically to help coal-dependent regions transition. Germany’s coal exit plan includes significant support packages for affected Länder (states) and workers.
30. Emerging Technologies in Energy
Artificial Intelligence in Energy Systems
Artificial intelligence (AI) and machine learning are transforming how energy systems are operated, planned, and maintained.
Key AI applications:
Predictive maintenance: Machine learning algorithms analyze sensor data from turbines, transformers, and other equipment to predict failures before they occur. This reduces unplanned downtime and maintenance costs. For example, GE Vernova’s Predix platform analyzes operational data from gas turbines to predict maintenance needs.
Renewable energy forecasting: AI models significantly improve the accuracy of solar and wind generation forecasts, enabling better grid balancing and reducing the need for backup generation. DeepMind’s AI improved wind power forecasting for Google’s fleet by approximately 20% (Google, 2019).
Grid optimization: AI dispatches generation assets and manages grid operations in real time, improving efficiency and reducing curtailment of renewable energy.
Energy demand forecasting: Accurate load forecasting reduces the need for expensive standby generation capacity.
Energy analytics for buildings and industry: AI-powered platforms identify energy waste and optimization opportunities across large building or industrial portfolios.
Data center energy management: Hyperscale data centers (Google, Microsoft, Amazon) use AI to optimize cooling systems, reducing cooling energy consumption. Google DeepMind reduced cooling energy in its data centers by 40% using AI.
Generative AI and energy demand: The rapid growth of large AI models is creating significant new electricity demand. The IEA estimates that AI-related electricity demand could reach 1,000 TWh per year by 2026 (IEA Electricity Report, 2024), equivalent to the entire electricity consumption of Japan.
Internet of Things (IoT) in Energy
The Internet of Things connects millions of sensors, meters, and devices across energy infrastructure, enabling real-time monitoring and automated management.
Applications:
- Smart meters communicating consumption data to utilities
- Oil and gas pipeline monitoring (pressure, flow, corrosion)
- Remote monitoring of solar and wind farms
- Smart building management systems
- Predictive maintenance of rotating machinery
- Grid asset monitoring and management
The global IoT in energy market was valued at approximately $24 billion in 2022 and is growing rapidly.
Digital Twins
A digital twin is a virtual replica of a physical asset, system, or process that is continuously updated with real-time sensor data and used for monitoring, simulation, and optimization.
Energy applications:
- Power plant digital twins for operational optimization and maintenance planning
- Wind turbine digital twins for performance monitoring and control optimization
- Grid digital twins for planning, training, and operational support
- City-scale energy digital twins for urban energy planning
Example: Siemens has developed digital twins for gas turbines that model component wear, allowing operators to extend maintenance intervals safely while reducing unexpected failures.
Cybersecurity in Energy Infrastructure
As energy systems become increasingly digitized and connected, cybersecurity has become a critical concern. Energy infrastructure is classified as Critical National Infrastructure (CNI) in most countries.
Key threats:
- Ransomware attacks: The Colonial Pipeline attack (2021) disrupted fuel supply to the U.S. East Coast, causing widespread fuel shortages and demonstrating the vulnerability of energy infrastructure.
- State-sponsored attacks: Nation-state actors have demonstrated the ability to disrupt power grids. The Ukraine power grid attacks of 2015 and 2016 left hundreds of thousands without power, using malware to cause substation outages.
- Industrial Control System (ICS) attacks: SCADA (Supervisory Control and Data Acquisition) systems controlling power plants and pipelines are increasingly targeted.
Defense approaches:
- Network segmentation (isolating operational technology networks from IT networks)
- Industrial-specific security monitoring
- Regular vulnerability assessments and penetration testing
- Incident response planning and exercises
- International cooperation and information sharing
Smart Metering
Smart meters are digital electricity meters that measure consumption in real time (typically in 15-minute intervals) and communicate data automatically to utilities.
Global rollout: The EU mandated smart meter rollout across member states, with the UK completing its rollout ahead of targets. The U.S. has over 115 million smart meters installed as of 2023 (EIA).
Benefits include:
- Accurate billing (eliminating estimated bills)
- Real-time consumption data for consumers
- Enabling time-of-use tariffs and demand response
- Faster outage detection and restoration
- Remote disconnection/reconnection for utilities
31. Future of Energy and Emerging Innovations
Small Modular Reactors (SMRs)
Small Modular Reactors are nuclear reactors with a power output of less than 300 MW per unit (compared to 1,000 to 1,700 MW for large conventional reactors). They are designed to be factory-fabricated and assembled on site, potentially reducing construction costs and timelines compared to large nuclear projects.
Advantages:
- Smaller financing requirements per unit
- Modular deployment (add capacity incrementally)
- Enhanced passive safety features (do not require active cooling in emergencies)
- Potential for off-grid deployment and industrial heat applications
- Factory manufacturing could improve quality and reduce costs
Status: Several SMR designs are under regulatory review or early deployment:
- NuScale Power Module (U.S.): 77 MW module (up to 6 per site). First design licensed by the NRC.
- Rolls-Royce SMR (UK): 470 MW units, targeting deployment in the early 2030s
- Holtec SMR-300 (U.S.): 300 MW design
- China’s HTR-PM high-temperature gas-cooled reactor is operational at 200 MW
Challenges: SMRs have not yet demonstrated the cost savings expected from factory production. The first of a kind units are expensive, and cost reductions depend on series production.
Nuclear Fusion
Fusion energy aims to replicate the process that powers the sun: fusing light nuclei (deuterium and tritium, isotopes of hydrogen) together, releasing enormous amounts of energy.
Potential advantages:
- Near-limitless fuel supply (deuterium from seawater, tritium bred from lithium)
- No long-lived radioactive waste
- No meltdown risk
- No carbon emissions
Current status: The most advanced government fusion project is ITER (International Thermonuclear Experimental Reactor) under construction in southern France, an international collaboration involving 35 countries. ITER is scheduled to achieve its first plasma in 2025 and demonstrate net fusion energy gain (Q greater than 1) by approximately 2040. Full commercial power plant demonstration is not expected before the 2050s.
Private fusion: A wave of private fusion companies is pursuing commercial fusion on accelerated timelines, including Commonwealth Fusion Systems (CFS), TAE Technologies, Helion Energy, and others. Commonwealth Fusion achieved a world record magnetic field strength of 20 tesla with a high-temperature superconducting magnet in 2021, a milestone for its SPARC compact tokamak design.
In December 2022, the National Ignition Facility (NIF) at Lawrence Livermore National Laboratory achieved the first-ever demonstration of net energy gain from laser fusion, producing 3.15 MJ of fusion energy from 2.05 MJ of laser energy delivered to the target.
Blockchain in Energy
Blockchain technology enables decentralized, transparent, and tamper-resistant record-keeping, with several potential applications in energy:
Peer-to-peer energy trading: Blockchain platforms can enable direct trading of renewable energy between producers and consumers without a utility intermediary. The Brooklyn Microgrid (U.S.) and LO3 Energy’s Transactive Grid demonstrated community-scale P2P energy trading on blockchain.
Renewable energy certificates (RECs) and Guarantees of Origin: Blockchain provides more transparent and verifiable tracking of renewable energy generation and certification.
EV charging payment and billing: Interoperable payment systems for EV charging across multiple networks.
Virtual Power Plants (VPPs)
A Virtual Power Plant (VPP) aggregates hundreds or thousands of distributed energy resources (solar panels, batteries, EV chargers, smart appliances) into a coordinated, software-managed system that can respond to grid signals as if it were a single power plant.
How VPPs work: A software platform communicates with thousands of distributed devices via the internet. When the grid needs power (or needs to reduce consumption), the platform simultaneously signals thousands of devices to discharge batteries, reduce loads, or increase generation.
Scale examples:
- Tesla Virtual Power Plant (South Australia): Aggregates thousands of residential Tesla Powerwalls to provide grid services to South Australia’s grid
- Swell Energy: U.S. VPP aggregating residential and commercial batteries
- AutoGrid, Voltus, OhmConnect: U.S.-based VPP operators managing large flexible demand portfolios
VPPs can provide grid frequency regulation, peak reduction, and demand response services at lower cost than dedicated grid-scale storage or peaking plants.
Green Hydrogen Economy
Green hydrogen (produced by water electrolysis powered by renewable electricity) is seen as a key enabler of decarbonizing sectors that cannot be directly electrified.
Cost trajectory: Green hydrogen production costs were approximately $4 to $8 per kilogram in 2023 in most markets, compared to grey hydrogen at $1 to $2/kg. With falling electrolyzer costs and cheaper renewable electricity, green hydrogen is projected to fall below $2/kg in many regions by 2030 (IRENA).
Global electrolyzer market: Total installed electrolyzer capacity was approximately 1.4 GW in 2022 (IEA). Announced projects would bring this to over 100 GW by 2030 if all proceed, though many face financing and policy uncertainty.
Space-Based Solar Power (SBSP)
Space-based solar power involves placing large solar energy collectors in geostationary orbit (~36,000 km altitude), where they receive solar radiation continuously (no night, no clouds) and transmit energy to Earth via microwave or laser beams to receiving stations (rectennas).
Potential advantages:
- Continuous power generation (no day/night cycle, no weather)
- High solar flux (no atmospheric absorption)
Status: The UK Space Energy Initiative is conducting detailed engineering studies. JAXA (Japan) has active research programs. The European Space Agency commissioned studies in 2023. The technology faces major challenges including launch costs, system scale (GW-scale systems would be enormous), beam focusing and safety, and on-orbit assembly. Most experts consider it a post-2050 possibility at commercial scale.
Advanced and Next-Generation Batteries
Solid-state batteries replace the liquid electrolyte of conventional lithium-ion batteries with a solid electrolyte. Potential benefits include higher energy density (by enabling lithium metal anodes), improved safety (no flammable liquid electrolyte), and longer cycle life. Companies including Toyota, QuantumScape, and Solid Power are developing solid-state batteries for EVs. Commercial deployment is targeted in the late 2020s.
Sodium-ion batteries: Similar chemistry to lithium-ion but using sodium instead of lithium. Sodium is much more abundant and cheaper than lithium. Current sodium-ion batteries have lower energy density than lithium-ion but may be competitive for stationary storage applications. CATL (China) launched commercial sodium-ion batteries in 2023.
Lithium-sulfur (Li-S) batteries: Theoretical energy density of Li-S is approximately 5 times higher than current lithium-ion. Commercialization is challenged by rapid capacity degradation (sulfur dissolution into electrolyte).
32. Electric Vehicles and Transportation Energy
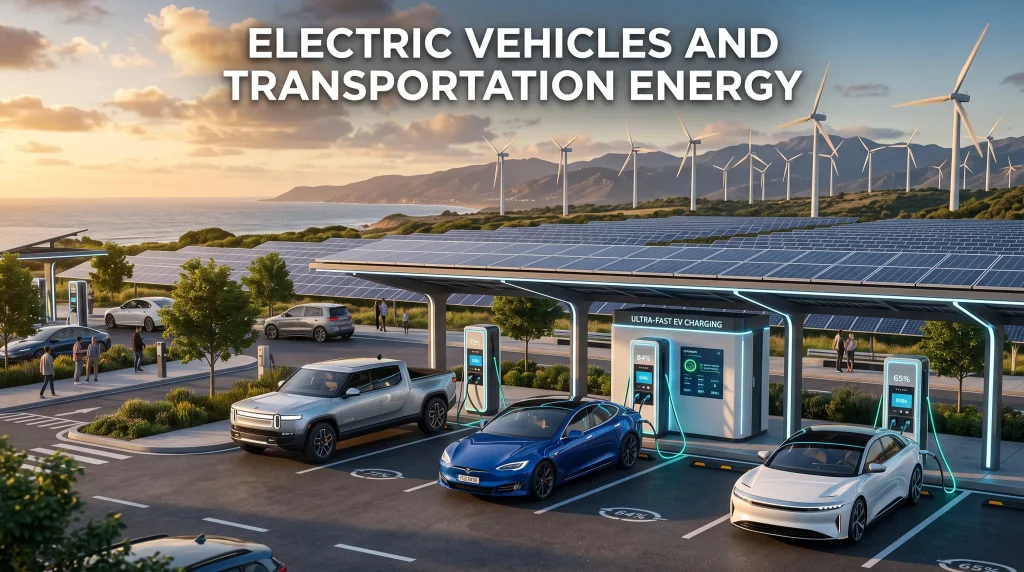
Transportation is responsible for approximately 26% of global energy-related CO2 emissions (IEA), making it a critical decarbonization target. Electric vehicles are the primary technology for decarbonizing road transport.
Global EV Market
Global EV sales reached approximately 13.7 million vehicles in 2023, representing approximately 18% of all new car sales worldwide (IEA Global EV Outlook 2024). China accounts for approximately 60% of global EV sales, followed by Europe and the U.S.
Total global EV stock reached approximately 40 million vehicles by end of 2023, still a small fraction of the approximately 1.4 billion total vehicles on the road globally.
Projections: The IEA’s Announced Pledges Scenario projects approximately 40% of global car sales to be electric by 2030. Several major automakers have announced plans to phase out internal combustion engine vehicle production between 2030 and 2040.
EV Battery Technology
EV batteries are large lithium-ion battery packs providing the energy storage for vehicle propulsion.
Key specifications:
- Energy capacity: Ranges from approximately 40 kWh (small EVs) to 200+ kWh (performance vehicles and trucks). Most mass-market EVs use 60 to 100 kWh packs.
- Range: Depends on battery capacity, vehicle efficiency, driving conditions, and temperature. Modern EVs achieve 250 to 600+ km per charge.
- Energy density: Current EV battery packs achieve approximately 150 to 250 Wh/kg at the pack level.
- Thermal management: Battery cells perform best at 15 to 35 degrees Celsius. Active liquid cooling or heating systems maintain this range, critical for performance and longevity.
Battery Management System (BMS): The BMS monitors and controls each cell in the battery pack, managing state of charge, state of health, temperature, and cell balancing. It is the critical safety and performance management system for the battery.
Battery degradation: Lithium-ion batteries degrade over time and with charge cycles. Modern EVs from Tesla, Hyundai, and others typically retain 75 to 90% of original capacity after 8 years or 150,000 km, with manufacturer warranties covering this period.
EV Charging Infrastructure
The availability, speed, and convenience of charging infrastructure are key factors in EV adoption.
| Level | Power (Typical) | Connection Standard | Charge Time (60 kWh battery) | Typical Location |
|---|---|---|---|---|
| Level 1 (120V AC, North America) | 1.4 kW | Standard household plug | 40 to 50 hours | Home (overnight) |
| Level 2 (240V AC) | 7 to 22 kW | J1772, Type 2 | 3 to 8 hours | Home, workplace, public |
| DC Fast Charging | 50 to 350 kW | CCS, CHAdeMO, NACS | 20 to 60 minutes (to 80%) | Highways, retail hubs |
| Ultra-High Power (400 to 900 kW) | Up to 900 kW | CCS, Proprietary | 10 to 20 minutes (to 80%) | Highway corridors |
Global public charging infrastructure: Over 2.7 million public charging points were installed worldwide by end of 2023 (IEA), with China accounting for approximately 70%. Rapid expansion is underway in Europe and North America.
Charging standards consolidation: In the U.S., the NACS (North American Charging Standard), originally developed by Tesla, has been adopted by Ford, GM, Rivian, Volvo, Mercedes, and other major automakers, establishing it as the U.S. standard alongside CCS.
Vehicle-to-Grid (V2G) Technology
V2G allows EV batteries to function as distributed grid storage, sending electricity back to the grid or to the home (V2H: vehicle-to-home) when needed.
Potential value: A typical EV battery (60 to 100 kWh) stores 2 to 4 times more energy than a typical home uses in a day. A fleet of EVs could collectively provide significant grid storage capacity.
Challenges:
- Requires bidirectional chargers (which add cost)
- Battery degradation from extra charge cycles (though managed correctly, V2G cycling can be designed to have minimal additional degradation)
- Grid and vehicle software integration complexity
- Need for standardized communication protocols
Commercial V2G: Nissan has offered V2G capability with the Leaf. Volkswagen is implementing V2G in Europe. The UK’s Ovo Energy launched a commercial V2G service. Many utility programs now offer V2G incentives.
Alternative Fuel Vehicles
Hydrogen Fuel Cell Electric Vehicles (FCEVs): Convert hydrogen to electricity via fuel cells, emitting only water vapor. Refueling takes 3 to 5 minutes (similar to gasoline). Current models include Toyota Mirai and Hyundai NEXO. FCEVs face the challenge of limited hydrogen refueling infrastructure and high hydrogen fuel costs. They may prove most competitive in heavy transport (trucks, buses) where long range and fast refueling are paramount.
Hybrid Electric Vehicles (HEVs): Combine an internal combustion engine with an electric motor and small battery. The electric motor assists the engine and recovers energy through regenerative braking. Hybrids do not plug in. Toyota is the global leader, with its Prius line having sold over 20 million hybrid vehicles since 1997.
Plug-in Hybrid Electric Vehicles (PHEVs): Have larger batteries than HEVs (typically 10 to 30 kWh) and can plug in to charge. They can drive on electric power alone for 30 to 80 km (sufficient for most daily commutes) and use the combustion engine for longer trips. PHEVs are sometimes considered a transitional technology.
Electric Trucks and Commercial Vehicles: Tesla Semi, Volvo FH Electric, DAF XF Electric, Mercedes eActros, and others are bringing battery electric trucks to market. Long-distance heavy trucking remains challenging for battery EVs due to battery weight and long charging times; hydrogen fuel cells may prove complementary.
Electric Aviation: Short-range electric aircraft (regional turboprops, air taxis) are under development by companies including Heart Aerospace, Wideroe Zero, and startup eVTOL (electric vertical takeoff and landing) companies like Joby Aviation and Lilium. Long-range electric aviation is limited by battery energy density.
Electric Shipping: Ferries and short-sea shipping are being electrified with battery systems. Maersk, the world’s largest shipping company, is developing ammonia-powered vessels for long-distance ocean shipping.
33. Energy Careers and Job Market
The global energy sector employs over 60 million people worldwide, and the energy transition is creating significant new employment while transforming existing roles.
According to IRENA’s World Energy Transitions Outlook 2023, the energy transition could create 85 million new jobs in renewables, energy efficiency, and related areas by 2030, more than offsetting the approximately 12 million jobs that could be lost in fossil fuel industries.
Career Overview
| Career | Typical Qualifications | Median Salary (U.S., 2023) | Growth Outlook |
|---|---|---|---|
| Energy Engineer | Bachelor’s in Mechanical/Electrical Engineering | $100,000 to $130,000 | Strong growth |
| Electrical Engineer (Power Systems) | Bachelor’s in Electrical Engineering | $95,000 to $135,000 | Steady growth |
| Petroleum Engineer | Bachelor’s in Petroleum Engineering | $130,000 to $180,000 | Declining long-term |
| HSE Officer | Safety certification, relevant experience | $65,000 to $100,000 | Steady |
| Solar PV Installer | Vocational training, NABCEP certification | $45,000 to $65,000 | Very fast growth |
| Wind Turbine Technician | Associate’s degree or vocational training | $50,000 to $75,000 | Very fast growth |
| Energy Auditor (CEM) | CEM certification, engineering background | $70,000 to $110,000 | Strong growth |
| Grid Operator | Technical training, operator certification | $70,000 to $110,000 | Strong growth |
| Sustainability Manager | Relevant degree + sustainability credentials | $90,000 to $140,000 | Very strong growth |
| Energy Policy Analyst | Bachelor’s to Master’s in policy, economics | $70,000 to $120,000 | Steady |
| Nuclear Engineer | Bachelor’s in Nuclear Engineering | $115,000 to $155,000 | Steady |
| Data Scientist (Energy) | Statistics, CS, engineering background | $110,000 to $160,000 | Very strong growth |
*Sources: U.S. Bureau of Labor Statistics (BLS) Occupational Outlook Handbook, 2023; various salary surveys*
Energy Engineer
Energy engineers design, develop, and optimize systems related to energy production, distribution, and consumption. They work across all energy sectors: power generation, industrial facilities, buildings, and renewable energy projects.
Specializations include:
- Energy systems design
- Renewable energy project engineering
- Energy efficiency engineering
- Grid planning and power systems engineering
- Hydrogen systems engineering
- Power electronics
Key certifications: Certified Energy Manager (CEM), Professional Engineer (PE) license, Leadership in Energy and Environmental Design (LEED) Accredited Professional.
Electrical Engineer (Power Systems)
Power systems electrical engineers focus on the design, operation, and optimization of electrical generation, transmission, and distribution systems.
Specializations:
- Power generation (thermal, nuclear, hydro, renewables)
- Transmission and distribution system planning
- Protection and control systems
- Power electronics and drives
- High-voltage engineering
- Smart grid and grid modernization
Key standards knowledge: IEEE standards, IEC standards, National Electrical Code (NEC), and specific utility interconnection standards (IEEE 1547 for distributed generation interconnection).
Renewable Energy Careers
Solar PV installer: The fastest-growing occupation in the U.S. energy sector. Installs photovoltaic systems on residential and commercial properties. Requires knowledge of electrical systems, roofing, and structural considerations. The NABCEP (North American Board of Certified Energy Practitioners) provides the primary certification.
Wind turbine technician: Maintains and repairs wind turbines, requiring work at heights (up to 100+ meters), mechanical and electrical skills, and hydraulic system knowledge. The BLS projects 45% job growth for wind turbine technicians from 2022 to 2032, among the fastest of any occupation.
Renewable energy project manager: Manages solar, wind, or other renewable energy projects from development through construction and commissioning. Requires project management skills combined with technical and regulatory knowledge.
Grid Operator
Grid operators (also called system operators or energy controllers) manage the real-time balance of electricity supply and demand across regional power networks from control centers.
Responsibilities:
- Monitoring grid frequency and voltage continuously
- Dispatching generation to meet demand
- Responding to generation outages or sudden demand changes
- Managing transmission congestion
- Coordinating with neighboring grid operators
Grid operators work in 24/7 control rooms and must be qualified and certified by their national or regional grid operator. In the U.S., NERC (North American Electric Reliability Corporation) establishes operator training and certification standards.
HSE Officer (Health, Safety, and Environment)
HSE Officers in the energy sector ensure compliance with safety regulations, conduct risk assessments, investigate incidents, and promote a positive safety culture.
Key responsibilities in energy facilities:
- Developing and implementing safety management systems
- Conducting and reviewing job hazard analyses (JHAs)
- Investigating incidents and near-misses to identify root causes
- Conducting safety training and competency assessments
- Managing environmental compliance and reporting
Certifications: NEBOSH (National Examination Board in Occupational Safety and Health) qualifications are internationally recognized. OSHA certifications are standard in the U.S. CSP (Certified Safety Professional) from BCSP is a senior-level credential.
Sustainability Manager
Sustainability managers develop and oversee organizational strategies to reduce environmental impact and meet ESG commitments.
Growing demand: As companies face increasing investor, regulatory, and public pressure to address climate risk and improve sustainability performance, demand for sustainability professionals has grown rapidly. The Global Jobs in Sustainability Study (PwC, 2023) found that green job postings grew by approximately 60% from 2022 to 2023.
You May Also Like It:
Xcel Power Shut Off: Everything You Need to Know About PSPS Outages
Consumers Energy Power Outage: How to Report, Track, and Stay Safe
Green Power Energy: The Complete Guide to Clean, Renewable Electricity
Power vs Energy: What Is the Difference and Why Does It Matter?
Public Power Energy Supplier: What It Is and How It Works
34. Energy Policy and Economics
Energy Policy Fundamentals
Energy policy encompasses the laws, regulations, incentives, and strategies that governments use to shape how energy is produced, distributed, and consumed.
Core policy goals (often in tension with each other):
- Energy security: Ensuring reliable, affordable energy supply
- Economic competitiveness: Maintaining affordable energy prices for industry and consumers
- Environmental protection: Reducing pollution and carbon emissions
- Energy equity: Ensuring access to affordable energy for all citizens
- Industrial policy: Capturing economic benefits of energy technology manufacturing
The energy policy trilemma (framed by the World Energy Council) describes the challenge of simultaneously achieving energy security, energy equity, and environmental sustainability. Progress on one dimension often comes at the cost of another.
Energy Economics
Energy economics studies how energy markets work: how energy prices are set, how supply and demand interact, and how policy interventions affect market outcomes.
Key concepts:
Levelized Cost of Energy (LCOE): The average cost of electricity over the lifetime of a power plant, calculated by dividing total lifetime costs (capital, fuel, operations and maintenance, decommissioning) by total lifetime electricity production. LCOE allows direct cost comparison between different technologies.
2023 global average LCOE estimates (IRENA Renewable Power Generation Costs 2023):
| Technology | Global Average LCOE (USD/kWh) |
|---|---|
| Utility-scale solar PV | 0.049 |
| Onshore wind | 0.033 |
| Offshore wind | 0.081 |
| Hydropower | 0.026 |
| Bioenergy | 0.072 |
| Geothermal | 0.061 |
| Natural gas (CCGT) | 0.057 to 0.120 (fuel price dependent) |
| Coal (supercritical) | 0.065 to 0.152 (fuel + carbon price dependent) |
| Nuclear (new build) | 0.060 to 0.210 (highly country-specific) |
Levelized Cost of Storage (LCOS): Extends LCOE methodology to energy storage, including charge/discharge cycles, round-trip efficiency losses, and storage capacity.
Merit order: In electricity markets, generators are dispatched in order of their short-run marginal cost (cheapest first). Since solar and wind have near-zero marginal cost, their widespread deployment lowers wholesale electricity prices (the “merit order effect”). This is beneficial for consumers but challenges the economics of conventional power plants that used to set market-clearing prices.
Energy Subsidies
Energy subsidies distort market prices, either by reducing costs for consumers or producers of specific energy forms.
Scale of global energy subsidies:
- Fossil fuel subsidies (explicit government support + implicit subsidies from not pricing environmental externalities): Estimated at $7 trillion in 2022 (IMF), or approximately 7.1% of global GDP. The vast majority of this is “implicit” (the gap between actual price and efficient price including climate and air pollution damages).
- Explicit (direct) fossil fuel subsidies were approximately $1 trillion in 2022 due to government price controls during the energy crisis.
- Renewable energy subsidies globally were approximately $500 billion in 2022 (IEA).
Policy debate: Fossil fuel subsidies are widely criticized by economists and environmental advocates for inhibiting the energy transition and wasting public funds. Reforming them is politically difficult because they often benefit poor households and politically important industries.
Electricity Markets and Pricing
Regulated utilities: In many markets, vertically integrated utilities own generation, transmission, and distribution, with prices set by regulators based on cost-plus principles. Most U.S. states with public utilities use some form of cost-of-service regulation.
Deregulated (liberalized) markets: Generation is competitive, with multiple producers selling electricity in wholesale markets. Transmission and distribution remain regulated. The UK, Australia, Texas, and most of Europe operate competitive wholesale electricity markets.
Wholesale electricity pricing: In competitive markets, electricity is traded in spot markets (real-time or day-ahead). Prices fluctuate based on supply and demand. Negative prices occur when renewable generation exceeds demand and inflexible baseload plants cannot reduce output quickly.
Retail tariff structures:
- Flat rate: Constant price per kWh regardless of time of use
- Tiered (block) pricing: Price per kWh increases as consumption increases (conservation incentive)
- Time-of-use (TOU): Higher prices during peak hours (typically evenings), lower during off-peak
- Real-time pricing (RTP): Price reflects actual wholesale market price, requiring smart meters
Energy Investment Trends
Global clean energy investment has been growing rapidly:
Global energy investment (IEA, 2023):
- Clean energy (renewables, EVs, efficiency, nuclear, grids): Approximately $1.8 trillion
- Fossil fuels (oil, gas, coal supply and power): Approximately $1.0 trillion
For the first time in history, clean energy investment now exceeds fossil fuel investment by a significant margin. The ratio was approximately 1:1 in 2020; it has shifted to nearly 2:1 in favor of clean energy.
Key investment categories:
- Solar PV: ~$380 billion (largest single category)
- Wind power: ~$310 billion
- Grid infrastructure: ~$310 billion
- EV manufacturing and charging infrastructure: ~$280 billion
- Energy efficiency in buildings and industry: ~$270 billion
The role of policy in driving investment: The U.S. Inflation Reduction Act (IRA) is the world’s largest clean energy industrial policy, offering ~$370 billion in tax credits, grants, and other incentives for clean energy manufacturing and deployment. Early evidence suggests it is driving significant new investment in U.S. clean energy manufacturing.
35. Energy Glossary
Core Energy and Power Terms
Alternating Current (AC): Electrical current that periodically reverses direction. Standard for grid power worldwide.
Baseload Power: The minimum continuous level of electricity demand on the grid. Baseload plants run continuously at high output.
Capacity Factor: The ratio of actual electricity output over a period to the maximum possible output if the plant ran at full capacity continuously. A capacity factor of 40% means the plant generated 40% of what it could have if running at full power continuously.
Capacity Market: A market mechanism where generators receive payments for being available to produce power (capacity), not just for the energy they produce.
Carbon Capture and Storage (CCS): Technology that captures CO2 from emission sources and injects it into geological formations for permanent storage.
Curtailment: Reduction of output from a generator (often a renewable source) below what it could produce, due to grid constraints, transmission limits, or excess supply.
Direct Current (DC): Electrical current flowing in one constant direction. Used in batteries, electronics, and solar panels.
Dispatchable Power: Generation that can be controlled and adjusted on demand (natural gas, hydro, nuclear). Contrasts with variable renewable generation.
Energy Mix: The combination of different energy sources (coal, gas, nuclear, renewables) used to supply total energy demand.
Firm Power: Reliable power that can be counted on to be available at all times. Contrasts with intermittent renewable generation.
Grid Parity: The point at which an alternative energy source (like solar or wind) generates electricity at a cost equal to or lower than grid electricity from conventional sources. Solar has reached grid parity in most global markets.
Intermittency: The variable and weather-dependent nature of solar and wind power output.
Levelized Cost of Energy (LCOE): The average cost of electricity over the lifetime of a plant, expressed in dollars per kWh or similar units.
Load: The electrical power consumed by devices and systems connected to the grid. Also refers to a device that consumes electrical power.
Merit Order: The ranking of generators by their short-run marginal cost, used in competitive electricity markets to dispatch the cheapest generation first.
Peak Demand: The highest level of electricity demand experienced during a given period.
Power Factor: The ratio of real power (watts) to apparent power (volt-amperes) in an AC circuit. A power factor of 1.0 indicates perfect efficiency.
Primary Energy: The total energy content of natural energy resources before conversion.
Spinning Reserve: Generating capacity that is online and synchronized to the grid but not fully loaded, capable of increasing output within seconds to respond to sudden generation loss.
Renewable Energy Certificate (REC): A market-based instrument representing proof that 1 megawatt-hour of electricity was generated from a renewable energy source.
Stranded Asset: An asset (such as a coal power plant) that loses its economic value before the end of its expected useful life, often due to regulatory changes or technology competition.
Virtual Power Plant (VPP): Software-managed aggregation of distributed energy resources (batteries, solar panels, flexible loads) that acts as a coordinated power source.
Electrical Terms
Ampere (A): The SI unit of electric current. One ampere equals one coulomb of charge flowing per second.
Busbar: A conducting bar distributing power to multiple circuits within a switchgear panel or substation.
Circuit Breaker: A switching device that automatically interrupts current flow during faults or overloads. Unlike fuses, circuit breakers can be reset and reused.
Distributed Energy Resources (DER): Small-scale electricity generation or storage systems located close to where electricity is consumed.
Earth Fault (Ground Fault): An unintended electrical connection between a live conductor and earth (ground).
Frequency (Hz): The number of complete AC cycles per second. Standard frequencies: 50 Hz (most of the world) or 60 Hz (North America, parts of South America, Japan).
Ground (Earth): A reference connection to the earth, providing a safe path for fault currents.
Harmonic: A voltage or current component at a frequency that is an integer multiple of the fundamental frequency.
Impedance: Total opposition to AC current flow, combining resistance and reactance, measured in ohms.
Induction Motor: The most common type of AC electric motor, using electromagnetic induction rather than physical connections to drive the rotor.
Inverter: A device converting DC electricity to AC electricity.
Load Factor: The ratio of average load over a period to peak load during that period. High load factor indicates efficient use of generation capacity.
Neutral: The return conductor in AC distribution systems. In a balanced three-phase system, the neutral carries no current.
Ohm: The SI unit of electrical resistance. One ohm means one volt drives one ampere of current.
Phasor: A complex number representation of a sinusoidal quantity (voltage or current) in AC circuit analysis.
Power Quality: The stability and cleanliness of electrical power: freedom from harmonics, voltage fluctuations, and other disturbances.
Reactance: Opposition to AC current flow caused by inductors (inductive reactance) or capacitors (capacitive reactance).
Rectifier: A device converting AC electricity to DC electricity.
Short Circuit: An unintended low-resistance connection between conductors, causing very high current flow.
Switchgear: Equipment for switching, protecting, and controlling electrical circuits, including circuit breakers, switches, and fuses.
Transformer: A device using electromagnetic induction to transfer electrical energy between circuits at different voltages.
Volt: The SI unit of electric potential difference (voltage). One volt drives one ampere through one ohm of resistance.
Watt: The SI unit of power. One watt equals one joule per second.
Oil and Gas Terms
Asset Integrity Management: The systematic process of ensuring that equipment and systems perform their intended function safely and reliably throughout their operational life.
Barrel (bbl): Standard unit of volume for petroleum. One barrel = 42 U.S. gallons = 159 liters.
Blowout: Uncontrolled release of crude oil or natural gas from a well. The Deepwater Horizon blowout (2010) released approximately 4.9 million barrels of oil into the Gulf of Mexico.
Christmas Tree: The assembly of valves, gauges, and chokes at a wellhead controlling production flow.
Flaring: Controlled combustion of natural gas at oil production and processing sites, typically used to safely dispose of gas that cannot be economically captured. Globally, approximately 140 billion cubic meters of gas is flared annually (World Bank Global Gas Flaring Reduction Partnership), a significant source of CO2 and methane emissions.
Hydrocarbon: Organic compounds consisting of hydrogen and carbon. The primary components of crude oil and natural gas.
LPG (Liquefied Petroleum Gas): A mixture of propane and butane, compressed into liquid form. Used for heating, cooking, and vehicle fuel.
Natural Gas Liquids (NGLs): Hydrocarbons heavier than methane extracted from natural gas streams, including ethane, propane, butane, and pentane.
OPEX vs CAPEX: Operating Expenditure (ongoing costs of running facilities) vs. Capital Expenditure (investment in physical assets). Managing the balance between OPEX and CAPEX is central to oil and gas company economics.
Proved Reserves: Quantities of hydrocarbons that can be economically extracted with reasonable certainty under current economic and operating conditions.
Reservoir: An underground rock formation containing extractable oil or natural gas, characterized by porosity (pore space) and permeability (ability of fluids to flow).
Spot Price: The current market price for immediate delivery of a commodity (oil, natural gas, LNG).
Wellhead: The surface equipment at the top of an oil or gas well, including valves and fittings that control production flow.
36. Frequently Asked Questions
Q: What is the difference between energy and power?
Energy is the total capacity to do work, measured in joules or kilowatt-hours (kWh). Power is the rate at which work is performed or energy is transferred, measured in watts. Energy = Power x Time. For example, a 2,000-watt electric heater running for 3 hours uses 6 kWh of energy.
Q: Which energy source is the cheapest today?
New solar PV and onshore wind are now the cheapest sources of new electricity generation in most of the world, with global average LCOEs of $0.049/kWh and $0.033/kWh respectively (IRENA, 2023). These costs have fallen by approximately 89% and 69% respectively since 2010.
Q: Is nuclear energy renewable?
No. Nuclear energy is classified as non-renewable because it depends on finite uranium reserves. However, nuclear energy is low-carbon, producing only about 12 gCO2eq per kWh on a lifecycle basis, comparable to wind and hydropower.
Q: What is the main cause of rising carbon emissions from energy?
The primary cause is combustion of fossil fuels (coal, oil, and natural gas) for electricity generation, transportation, and industrial processes. Electricity and heat generation is the single largest source, accounting for approximately 43% of global energy-related CO2 emissions.
Q: How does a smart grid differ from a traditional grid?
A smart grid uses digital communication, sensors, and automation to enable real-time monitoring and bidirectional communication between utilities and consumers. It can detect and isolate faults automatically, integrate variable renewable energy more effectively, and support demand response programs. A traditional grid is largely electromechanical with limited real-time visibility or automation.
Q: What is renewable energy intermittency and how do we solve it?
Intermittency refers to the variable nature of solar and wind generation, which depends on weather conditions. Solutions include energy storage (batteries, pumped hydro), grid interconnections (importing from regions with better conditions), demand response (shifting flexible loads to periods of high renewable generation), and flexible backup generation (gas, hydro). Grid operators also use advanced forecasting to anticipate output variations.
Q: What safety measures are essential in electrical work?
Essential safety measures include: always verifying circuits are de-energized before working on them, using Lockout Tagout (LOTO) procedures, wearing appropriate PPE (arc-rated clothing, rubber insulating gloves), maintaining safe approach distances from energized conductors, following NFPA 70E and applicable codes, and never working alone on hazardous tasks.
Q: What is the role of energy storage in renewable energy adoption?
Storage allows energy generated when renewable output is high (sunny midday, windy nights) to be stored and dispatched when demand is high or generation is low. This addresses the intermittency problem, enabling higher penetrations of solar and wind without grid instability. Pumped hydro currently provides over 90% of global storage, but grid-scale batteries are growing rapidly.
Q: What career paths are available in the energy sector?
Energy careers include energy engineers, electrical engineers (power systems), petroleum engineers, HSE officers, grid operators, energy auditors, renewable energy technicians (solar installers, wind turbine technicians), sustainability managers, energy policy analysts, data scientists, energy traders, and project developers. The energy transition is creating strong demand for clean energy-focused roles.
Q: How is electricity transmitted over long distances without losing too much energy?
Electricity is transmitted at very high voltages (66 kV to 765 kV or higher) to minimize resistive losses. Since power loss equals current squared times resistance, increasing voltage reduces current for the same power level, dramatically reducing losses. Step-up transformers at power plants raise voltage for transmission; step-down transformers at substations reduce it for distribution.
Q: What is the difference between upstream, midstream, and downstream in oil and gas?
Upstream covers exploration and production (finding and extracting oil and gas). Midstream covers transportation and storage (pipelines, LNG tankers, storage terminals). Downstream covers refining and distribution (converting crude oil into usable products and delivering to consumers).
Q: What is a microgrid and how does it differ from the main grid?
A microgrid is a localized electrical system that integrates local generation (solar, diesel, fuel cells), energy storage, and controllable loads, and can operate either connected to the main grid or independently (islanded). Microgrids provide enhanced reliability, can integrate local renewable resources efficiently, and are valuable for remote communities, military bases, hospitals, and industrial facilities.
Q: What is the difference between AC and DC power?
Alternating current (AC) periodically reverses direction at a set frequency (50 or 60 Hz). It is used for grid power because it can be transformed to different voltages easily using transformers. Direct current (DC) flows in one constant direction, used in batteries, electronics, solar panels, and increasingly in long-distance HVDC transmission.
Q: What is grid parity and why does it matter?
Grid parity is the point where the cost of generating electricity from a particular source (typically renewable) equals the cost of buying grid power. When solar or wind reach grid parity, they are economically competitive without subsidies. Solar PV has reached or exceeded grid parity in most global markets as of 2024, making it the cheapest electricity source in history.
Q: How does a combined cycle gas turbine (CCGT) work and why is it more efficient?
A CCGT uses a gas turbine to generate electricity first. The hot exhaust gas from the gas turbine is then used to generate steam in a heat recovery steam generator (HRSG), which drives a second steam turbine to generate additional electricity. This two-step process achieves efficiency of 55 to 62%, compared to 33 to 43% for a simple cycle gas turbine, because it recovers energy that would otherwise be wasted as exhaust heat.
Q: What is a power purchase agreement (PPA) and how does it work?
A Power Purchase Agreement (PPA) is a long-term contract between a power generator (typically a renewable energy project) and an electricity buyer (utility, government, or corporate buyer). The buyer agrees to purchase electricity at a fixed price for 10 to 25 years, providing revenue certainty that enables project financing. Corporate PPAs allow companies like Google, Amazon, and Microsoft to claim use of renewable energy and help finance new renewable projects.
Q: What is energy poverty and how many people experience it?
Energy poverty refers to lack of access to modern energy services: reliable electricity and clean cooking fuels. Approximately 733 million people lack electricity access globally (IEA, 2022), primarily in Sub-Saharan Africa and parts of Asia. An additional 2.3 billion people rely on traditional biomass (wood, charcoal, animal dung) for cooking, causing severe indoor air pollution. Energy poverty is closely linked to overall development outcomes in health, education, and economic opportunity.
Q: What is the difference between energy intensity and energy efficiency?
Energy intensity is the amount of energy consumed per unit of economic output (GDP). A country with lower energy intensity is more energy-efficient relative to its economic size. Energy efficiency refers to using less energy to provide the same service or output. Improving energy efficiency reduces energy intensity. Global energy intensity has been declining at approximately 1.6% per year, but this is insufficient for climate targets, which require 4% annual improvement (IEA).
Q: What are Virtual Power Plants and how do they differ from real power plants?
A Virtual Power Plant (VPP) aggregates distributed energy resources (home batteries, EV chargers, smart appliances, commercial demand response) and coordinates them through software to behave like a single, flexible power plant that can respond to grid signals. Unlike a physical power plant, a VPP has no single geographic location. Its capacity comes from the combined flexibility of thousands of distributed assets.
Q: How do hydrogen fuel cells work?
Hydrogen fuel cells generate electricity through an electrochemical reaction (not combustion): hydrogen (H2) molecules are split into protons and electrons at the anode. Electrons flow through an external circuit (generating electricity) while protons pass through the electrolyte membrane to the cathode, where they combine with oxygen and electrons to form water. The only byproduct is water vapor, making fuel cells emission-free at the point of use (though upstream hydrogen production may have emissions depending on the production method).
Q: What is demand response and who can participate?
Demand response (DR) programs allow electricity consumers to reduce or shift their consumption in exchange for payments or lower tariffs, typically during periods of peak grid stress or high prices. Industrial facilities (the largest participants), commercial buildings, and increasingly residential customers with smart thermostats, batteries, or EV chargers can participate. DR effectively provides flexible capacity to the grid without building additional generation.
Q: What is the difference between energy storage and demand response?
Energy storage physically stores energy (in batteries, pumped water, compressed air) and discharges it later. Demand response shifts when consumers use energy (moving consumption from peak to off-peak periods) but does not involve physical energy storage. Both achieve similar grid balancing effects but through different mechanisms. They are complementary tools.
Q: How do wind turbines produce electricity in light winds and stop in strong winds?
Wind turbines begin generating at their “cut-in” wind speed (approximately 3 to 4 m/s). They reach maximum output (rated power) at their “rated wind speed” (approximately 12 to 15 m/s). Above the “cut-out” wind speed (typically 25 m/s), turbines shut down to prevent mechanical damage. At high wind speeds, blade pitch is adjusted (feathered) to spill wind and reduce rotation speed, protecting the turbine while allowing some continued operation.
Q: What is Energy Star and how does it help consumers?
Energy Star is a voluntary energy efficiency certification program run by the U.S. Environmental Protection Agency (EPA) and the U.S. Department of Energy. Products certified with the Energy Star label meet specific energy efficiency criteria, typically consuming 10 to 50% less energy than standard models. As of 2022, Energy Star has saved U.S. consumers and businesses approximately $500 billion in energy costs and prevented 4 billion metric tons of greenhouse gas emissions since its launch in 1992.
Q: What is flue gas desulfurization (FGD) and why is it used in power plants?
Flue gas desulfurization (FGD), also called scrubbing, is a process that removes sulfur dioxide (SO2) from the exhaust gases of coal-fired power plants before they are released to the atmosphere. SO2 is a major air pollutant that causes acid rain and respiratory disease. FGD systems use limestone slurry or other reagents to absorb and neutralize SO2. Most coal plants in developed countries are required by environmental regulations to use FGD systems.
Q: What is the water-energy nexus?
The water-energy nexus describes the interdependence between water and energy: energy production requires water (for cooling thermoelectric plants, hydropower, and processing fuels), and water treatment and supply requires energy (for pumping, treatment, and desalination). Droughts can severely reduce hydropower output and force thermal plants to reduce generation (due to insufficient cooling water). This nexus is increasingly important as both water stress and energy demand grow simultaneously in many regions.
Q: What is the difference between ISO 50001 and Energy Star?
ISO 50001 is an international management system standard providing a framework for organizations to implement systematic energy management and continuously improve energy performance. Energy Star is a U.S. product and building certification program identifying the most energy-efficient products and buildings. ISO 50001 is about management processes; Energy Star is about the performance of specific products and buildings.
Q: What are scope 1, 2, and 3 emissions?
These categories are defined by the Greenhouse Gas Protocol (GHG Protocol) for organizational carbon accounting. Scope 1 covers direct emissions from sources owned or controlled by the organization (combustion in owned vehicles and boilers, industrial processes). Scope 2 covers indirect emissions from purchased electricity, heat, or steam. Scope 3 covers all other indirect emissions in the value chain (upstream supply chain, downstream use of sold products, employee travel, waste disposal). Scope 3 typically represents the largest share of a company’s total carbon footprint.
Q: What is an oil refinery and what products does it produce?
An oil refinery is an industrial facility that processes crude oil into more useful petroleum products through processes including distillation (separating components by boiling point), cracking (breaking large molecules into smaller, more valuable ones), reforming, and treating (removing impurities). Major products include gasoline, diesel, jet fuel, kerosene, heating oil, LPG, asphalt, and petrochemical feedstocks.
Q: How does electricity pricing work in deregulated markets?
In deregulated electricity markets, wholesale electricity prices are determined by supply and demand in real-time and day-ahead auctions. Generators bid to supply power at a price they are willing to accept; the market operator accepts the cheapest bids until supply equals demand. The marginal bid that clears the market sets the price paid to all generators in that period. Since solar and wind have near-zero marginal costs, their operation frequently sets low or even negative market prices, particularly during periods of high renewable output.
About This Guide
This comprehensive guide to Energy and Power is intended as an authoritative reference covering all major aspects of the energy sector. We update this guide regularly to reflect new data, technological developments, and policy changes. If you would like to suggest additions, corrections, or updates, please contact us.
Disclaimer: While every effort has been made to ensure accuracy, the energy sector is rapidly evolving. For specific engineering, investment, or policy decisions, please consult qualified professionals and primary sources including the IEA, IRENA, EIA, and relevant regulatory bodies.
You May Also Like It:
Power Outage Safety Guide: How to Prepare for Outages and Emergencies
Power to Choose in Texas: The Complete Guide to Comparing Electricity Plans
CenterPoint Outage Map Houston: How to Report and Track Power Outages
Consumers Outage Map: Complete Guide to Tracking Power Outages in Michigan
Power Distribution System: How It Works, What Fails, and How to Size It Right