

By Midwest Editorial Team, Operations and Lean Manufacturing | Updated October 2026
The first OEE calculation I ran on a packaging line did not go well. The plant manager expected something near 85%. The sheet said 62%. Nobody argued with the math, but everybody argued with the data, and that argument taught me more than any textbook.
This guide gives you the formulas, the order of operations and the traps, so your first result is one you can defend on the shop floor.
OEE (Overall Equipment Effectiveness) is calculated by multiplying three ratios: Availability (run time ÷ planned production time), Performance (total count ÷ the count possible at ideal speed during run time) and Quality (good count ÷ total count). The OEE formula is OEE = Availability × Performance × Quality. A one-line shortcut gives the same answer: OEE = (Good Count × Ideal Cycle Time) ÷ Planned Production Time.
Gather These Six Inputs Before Touching a Calculator
Every OEE calculation rests on six numbers. Get these wrong and the formula only gives you a precise wrong answer.
- Shift length: total scheduled minutes on the clock.
- Breaks: time when nobody intends to run. Remove it from the base before anything else.
- Stop time: every minute the machine should have run but did not. Breakdowns, changeovers, waiting for material, all of it.
- Ideal cycle time: the fastest repeatable time per part, or its reciprocal, the ideal run rate in parts per minute.
- Total count: everything the machine produced, good and bad.
- Reject count: scrap plus anything that needed rework.
One decision deserves extra care: the ideal cycle time. Nameplate speed is often a brochure number that no real line ever reaches. I prefer the best sustained rate from history, such as the cleanest hour of the last quarter, confirmed with maintenance.
Whatever you choose, write it down and freeze it. Changing the ideal rate mid-year breaks every trend line you built.
Also decide your stop threshold early. On filling lines I usually log stops from two to five minutes and above. Anything shorter falls into Performance, which is where it belongs.
OEE Formula With Example: One 10-Hour Shift on a Bottling Line
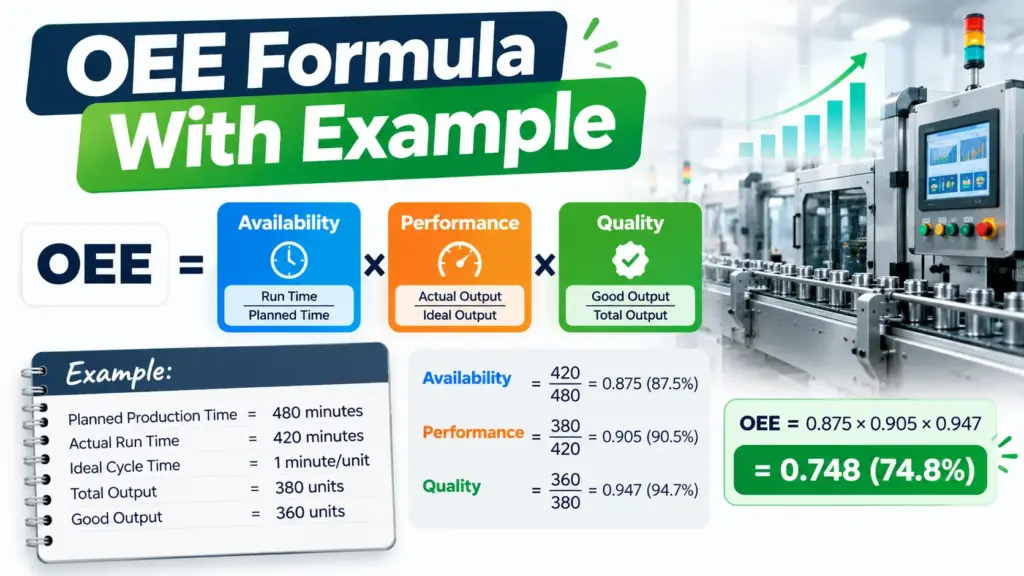
The figures below are illustrative, built from typical filling line data. Swap in your own numbers and the steps stay identical.
- Shift length: 600 minutes
- Breaks: two of 20 minutes
- Stops: breakdown 28 minutes, changeover 32 minutes, waiting for caps 15 minutes
- Ideal run rate: 100 bottles per minute
- Total count: 40,000 bottles
- Rejects: 1,200 bottles
| Step | Calculation | Result |
|---|---|---|
| Planned production time | 600 – 40 | 560 min |
| Stop time | 28 + 32 + 15 | 75 min |
| Run time | 560 – 75 | 485 min |
| Availability | 485 ÷ 560 | 86.61% |
| Performance | 40,000 ÷ (485 × 100) | 82.47% |
| Good count | 40,000 – 1,200 | 38,800 |
| Quality | 38,800 ÷ 40,000 | 97.00% |
| OEE | 0.8661 × 0.8247 × 0.97 | 69.3% |
Now run the cross-check. Good count divided by ideal rate times planned minutes gives 38,800 ÷ (100 × 560) = 69.29%. Same answer.
If the two methods disagree by more than rounding, one input is wrong. I run this check on every sheet before it leaves my desk.
Where the Lost Minutes Actually Went
Percentages hide scale. Convert each loss into minutes of the 560 planned and the priorities change.
- Availability loss: 75 minutes (560 minus 485 run minutes).
- Speed loss: 85 minutes. The line ran 485 minutes, but 40,000 bottles at 100 per minute only needs 400.
- Quality loss: 12 minutes. Of those 400 minutes, 388 made good bottles.
- Fully productive time: 388 minutes.
Add the losses: 75 + 85 + 12 = 172. That matches the gap between 560 and 388, so the books balance.
Most teams chase the 28-minute breakdown first because it is dramatic. Here, speed loss is the biggest bucket. On lines like this I usually find micro-stops, operators running below set speed, and a jammed infeed that clears itself.
One more translation helps in budget meetings. One OEE point on this line equals 5.6 planned minutes, or 560 good bottles per shift. Multiply that by your margin per bottle and people pay attention.
Calculating OEE Across Shifts, Lines and Mixed Products
Weighted Averages, Not Simple Ones
Never average OEE percentages directly. Say Line A scores 80% over 400 planned minutes and Line B scores 50% over 100 planned minutes. The simple average says 65%.
The weighted result is (0.80 × 400 + 0.50 × 100) ÷ 500 = 74%. Weight by planned production time, or the small, troubled line distorts the plant figure.
Several Products on One Machine
A single blended ideal cycle time falls apart when products run at different speeds. Sum the fully productive time per product instead.
Example: 3,000 good units of Product X at 6 seconds ideal gives 300 minutes. 1,500 good units of Product Y at 12 seconds ideal also gives 300 minutes. Total fully productive time is 600 minutes. Against 900 planned minutes, OEE is 66.7%.
Excel OEE Formula: A Layout You Can Copy
This single-shift layout reproduces the bottling example. Type the inputs in B2 to B7 and the rest calculates itself.
| Cell | Label | Entry |
|---|---|---|
| B2 | Shift length (min) | 600 |
| B3 | Breaks (min) | 40 |
| B4 | Stop time (min) | 75 |
| B5 | Ideal rate (units/min) | 100 |
| B6 | Total count | 40000 |
| B7 | Rejects | 1200 |
| B8 | Planned production time | =B2-B3 |
| B9 | Run time | =B8-B4 |
| B10 | Availability | =B9/B8 |
| B11 | Performance | =B6/(B9*B5) |
| B12 | Quality | =(B6-B7)/B6 |
| B13 | OEE | =B10B11B12 |
Three upgrades make it far more reliable:
- Error trap: wrap each ratio, for example =IFERROR(B6/(B9*B5),0), so an empty shift does not break the sheet.
- Sanity flag: in a spare cell, =IF(B11>1,”Check ideal rate”,””) catches the most common input mistake instantly.
- Rate conversion: if your ideal is given in seconds per part, enter =60/seconds in B5.
For a log with one row per shift, put planned minutes in column C and OEE in column F. Then =SUMPRODUCT(F2:F31,C2:C31)/SUM(C2:C31) returns the correctly weighted OEE for the period.
Mistakes That Quietly Skew an OEE Calculation

I have audited enough sheets to know the same errors appear everywhere.
- Performance above 100%: the ideal rate is set too low. Fix the standard, never cap the result.
- Breaks left in the base: lunch minutes then show up as availability loss, and the line looks worse than it is.
- Rework counted as good: OEE Quality is first pass. A part fixed later is still a quality loss.
- Micro-stops ignored: a ten-second jam repeated 200 times a shift costs over 30 minutes. Counters and cycle data catch it, notebooks do not.
- Changeovers treated as free: they are stop time. Leaving them out hides a real improvement target.
- Gamed stop codes: relabeling a breakdown as planned downtime flatters the score. Lock the reason codes and audit a few random shifts each month.
What Is a Good OEE Score? Benchmarks With Context
The figure you will see quoted most often is 85% as world class. It is built from 90% availability, 95% performance and 99% quality. About 60% is commonly described as typical for discrete manufacturing, and anything near 40% signals plenty of room to improve.
Treat those as signposts, not verdicts. Batch and continuous process plants often run on different norms, and a high-mix job shop may never see 85% for sound reasons.
My preference: compare a line with its own history and with sister lines running the same product. That comparison is fair and it drives action.
There is one blind spot to watch. OEE only measures planned time, so a plant running one shift in three can post a healthy score while assets sit idle for 16 hours. TEEP covers that gap: TEEP = OEE × (planned production time ÷ calendar time). Our example gives 0.693 × (560 ÷ 1,440) = 26.9%.
Turn the Number Into a Four-Step Action Plan
- Rank the losses in minutes, as we did above, not in percentage points.
- Pick one loss and name one owner. Spreading effort across five problems fixes none.
- Set a four-week target with a specific minute reduction, such as cutting speed loss from 85 to 60 minutes per shift.
- Re-measure with the same ideal rate and the same stop threshold, so any gain is real.
Post the shift result at handover. Operators who see the number daily usually start spotting the micro-stops before any software does.
FAQ
How often should I run an OEE calculation?
Calculate it every shift and review it weekly. Shift-level data shows patterns such as a weak night crew or a bad first hour after changeover. A monthly figure alone hides all of that.
Can I calculate OEE without a known ideal cycle time?
Yes, but you need a stand-in. Use the best sustained rate from your own production history and mark it as provisional. Revisit it after a month of clean data.
Should I calculate OEE per shift, per day or per week?
All three, using weighted averages. Shift results guide operators, daily results guide supervisors, and weekly results guide managers. Always weight by planned production time when rolling up.
How do I calculate OEE for batch or process industries like food and chemicals?
Replace parts with a unit of throughput such as kilograms or litres per hour. Set the ideal rate to the maximum demonstrated throughput, and define Quality as in-spec product divided by total product. The three-factor structure stays the same.
Do I need to calculate OEE for every machine or only the bottleneck?
Start with the bottleneck, because its lost minutes are lost output for the whole line. Add other machines once the first one is stable. An OEE gain on a non-bottleneck often just builds inventory.
Does planned maintenance count against OEE?
Under the standard method, yes. It reduces Run Time because the machine could have produced. If you exclude it from planned production time, document that choice and apply it everywhere, then show TEEP alongside so the cost stays visible.
Who should record the data: operators or engineers?
Operators should record stop reasons because they are standing at the machine. Engineers should own the ideal rate, the stop threshold and the monthly audit. Splitting it this way keeps the data honest and the standards stable.
You May Also Like It:
Industrial Management Definition: What It Actually Means
Operational Excellence Management: Building an Industrial Management System That Sticks