
Disclaimer: The information in this guide is for educational purposes only. Data cited from IEA, EIA, OPEC, BP, Wood Mackenzie, Rystad Energy, and other sources reflects publicly available figures at the time of writing. Oil and gas markets change rapidly – always verify current figures before making financial or operational decisions.
1. Introduction to Oil and Gas
Oil and gas are the twin pillars of the modern global economy. Despite decades of growth in renewable energy, fossil fuels still supplied approximately 82 percent of total global primary energy in 2023, according to the International Energy Agency (IEA). Of that, oil contributed around 31 percent and natural gas around 23 percent together accounting for more than half of all energy consumed on Earth.
Every time you fill a vehicle with petrol, fly in an aircraft, heat your home, buy a plastic product, or use a fertilizer-grown food product, you are touching the oil and gas value chain. The industry spans exploration in remote deserts and deep ocean floors, massive refineries that process hundreds of thousands of barrels per day, pipelines stretching thousands of kilometers, and financial markets that move billions of dollars on news of a single geopolitical event.
The global oil and gas industry generates revenues exceeding $5 trillion per year and directly employs more than 5 million people worldwide, with millions more in indirect and induced employment. National economies from Saudi Arabia to Norway, from Nigeria to the United States, are shaped and in some cases entirely defined by their oil and gas endowments.
At the same time, oil and gas are at the center of the most consequential challenge of our era: climate change. The combustion of oil and gas accounts for roughly 60 percent of global energy-related CO2 emissions. How the industry navigates the energy transition whether it adapts, declines, or transforms will determine much of the 21st century’s energy landscape.
This guide covers everything: the science of how hydrocarbons form, the engineering of how they are found and extracted, the economics of how they are priced and traded, the environmental consequences of their use, and the uncertain future the industry faces as the world attempts to decarbonize.
2. What Is Crude Oil?
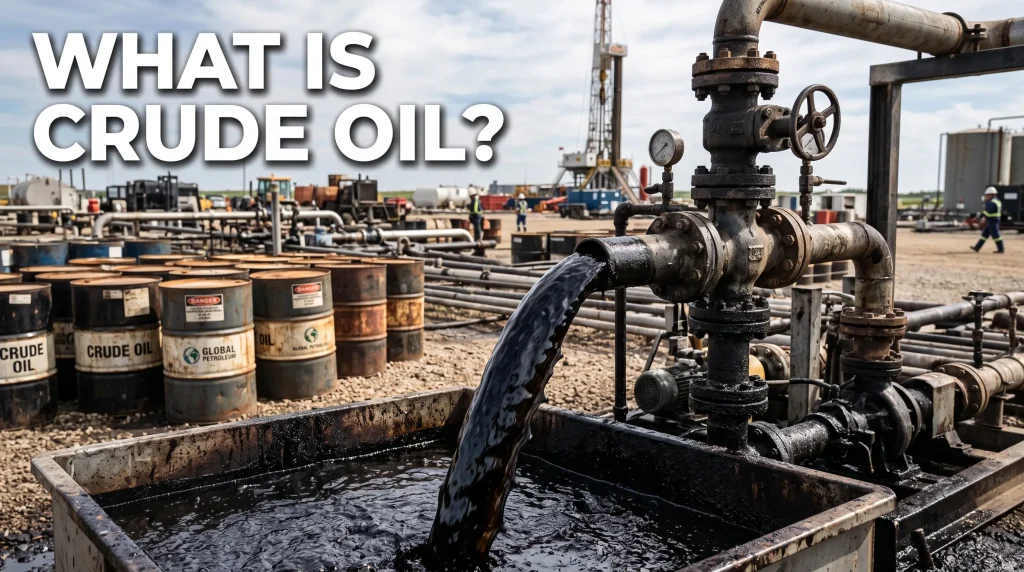
Crude oil is a naturally occurring, unrefined petroleum liquid composed of hydrocarbon deposits and other organic materials. It is found in underground rock formations called reservoirs and is extracted through wells drilled into the earth. Crude oil is the raw material from which the world refines gasoline, diesel, jet fuel, heating oil, lubricants, waxes, asphalt, and the feedstocks for plastics and chemicals.
Chemical Composition
Crude oil is not a single compound but a complex mixture of thousands of different hydrocarbon molecules, primarily composed of:
- Carbon: 83-87% by weight
- Hydrogen: 10-14% by weight
- Sulfur: 0.1-3% by weight (can reach 5% in heavy sour crudes)
- Nitrogen: 0.1-0.5% by weight
- Oxygen: 0.1-1.5% by weight
- Metals: Trace amounts of vanadium, nickel, iron, and copper
The hydrocarbons in crude oil range from very light (methane, ethane) to very heavy (asphaltenes with molecular weights in the thousands).
Types of Crude Oil
Crude oil is classified by two main characteristics: density (API gravity) and sulfur content.
By API Gravity (Density):
| Grade | API Gravity | Description | Examples |
|---|---|---|---|
| Extra Light | Above 45 degrees API | Very thin, flows easily | Condensate |
| Light | 31.1-45 degrees API | Most refined, highest value | WTI, Brent, Bonny Light |
| Medium | 22.3-31.1 degrees API | Moderate refining cost | Dubai, Oman |
| Heavy | 10-22.3 degrees API | Thick, harder to refine | Mexican Maya, Venezuelan Merey |
| Extra Heavy | Below 10 degrees API | Near-solid at surface | Canadian oil sands bitumen |
By Sulfur Content:
| Grade | Sulfur Content | Classification |
|---|---|---|
| Sweet crude | Less than 0.5% sulfur | Preferred by refiners, lower cost to process |
| Sour crude | More than 0.5% sulfur | Requires desulfurization, trades at discount |
Light sweet crude (such as WTI and Brent) commands the highest prices because it yields more high-value products and is cheaper to refine. Heavy sour crude requires more complex refinery configurations and therefore trades at a discount.
Key Crude Oil Benchmarks
- West Texas Intermediate (WTI): The primary US benchmark. Light sweet crude. Delivery at Cushing, Oklahoma.
- Brent Crude: The global benchmark for about two-thirds of the world’s oil. Blend of crude from North Sea fields. Light sweet.
- Dubai/Oman Crude: The primary benchmark for Middle Eastern oil sold to Asia. Medium sour.
- OPEC Basket: Weighted average of prices for oil from OPEC member countries.
- Urals: Russian benchmark crude. Medium sour. Trades at discount to Brent.
You May Also Like It:
ZNOG Stock: Complete Investor Guide to Zion Oil & Gas (OTCMKTS: ZNOG)
Oil Smells Like Gas? 7 Causes, Warning Signs, and Fixes
Oil Well Packer: Complete Guide to Types, Functions, and Selection
Midstream Oil and Gas: Guide to What It Is and How It Works
3. What Is Natural Gas?
Natural gas is a fossil fuel formed from the same organic processes as oil but consisting primarily of methane (CH4) along with other light hydrocarbons and impurities. It is one of the cleanest-burning fossil fuels, releasing about 50 percent less CO2 per unit of energy than coal when combusted, which has led to it being positioned as a “transition fuel” in many countries’ decarbonization strategies.
Composition of Natural Gas
| Component | Typical Range | Purpose |
|---|---|---|
| Methane (CH4) | 70-90% | Primary energy component |
| Ethane (C2H6) | 0-20% | Petrochemical feedstock |
| Propane (C3H8) | 0-8% | LPG, heating |
| Butane (C4H10) | 0-5% | LPG, lighter fuel |
| Carbon dioxide (CO2) | 0-8% | Must be removed before pipeline injection |
| Nitrogen (N2) | 0-5% | Inert diluent |
| Hydrogen sulfide (H2S) | 0-5% | Toxic; removed in processing (sour gas) |
| Water vapor | Trace | Must be dehydrated |
Types of Natural Gas Deposits
Conventional gas: Found in porous reservoir rock, often above oil. Flows freely to the surface once a well penetrates the reservoir.
Unconventional gas:
- Shale gas: Trapped in low-permeability shale rock. Requires hydraulic fracturing (fracking) to extract. The US shale gas revolution transformed global markets.
- Tight gas: Trapped in low-porosity sandstone or limestone.
- Coalbed methane (CBM): Methane adsorbed into coal seams. Released when reservoir pressure is lowered by removing water.
- Gas hydrates: Methane molecules trapped in ice-like crystal structures on the seafloor and in permafrost. Estimated reserves are enormous potentially more than all other fossil fuels combined but no commercial extraction exists yet.
Associated vs Non-Associated Gas
Associated gas is found dissolved in oil reservoirs and is produced alongside crude oil. Historically, associated gas was often flared (burned off) when infrastructure to capture it did not exist. Global gas flaring burned approximately 139 billion cubic meters in 2022 (World Bank), releasing significant CO2 and wasting valuable energy.
Non-associated gas is found in reservoirs that contain little or no crude oil. Most of the world’s giant gas fields Russia’s Urengoy field, Qatar’s North Field, Iran’s South Pars are non-associated.
4. History of the Oil and Gas Industry
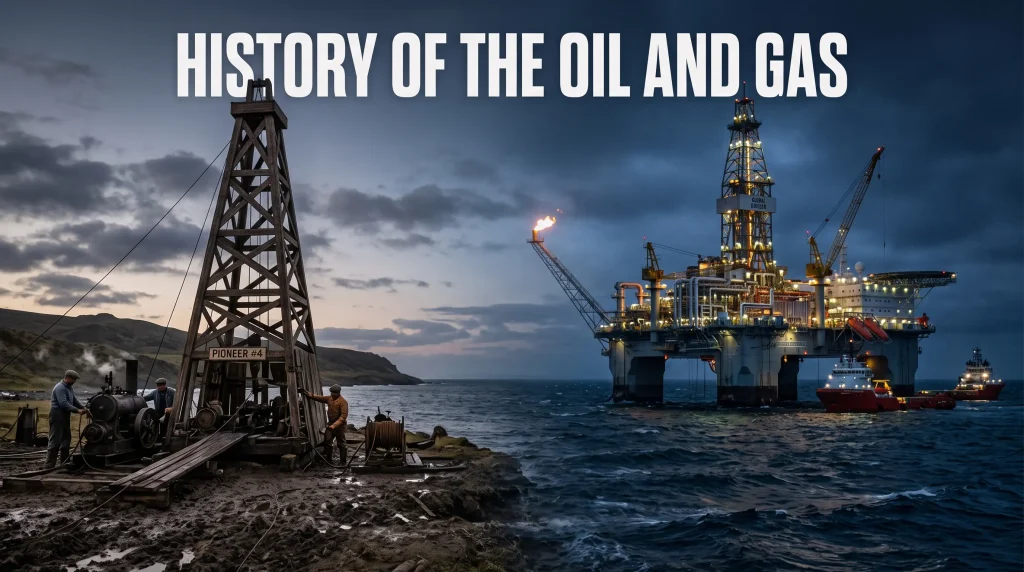
The story of oil and gas is, in many ways, the story of industrial civilization itself.
Ancient Uses of Petroleum
Petroleum in its natural surface seep form was known to ancient civilizations. Babylonians used bitumen (a heavy petroleum residue) to waterproof boats and buildings as far back as 4000 BC. The ancient Chinese drilled bamboo-cased wells to reach brine and natural gas by 100 AD. Persian merchants used surface oil seeps for lighting and medicine.
The Birth of the Modern Industry (1850s-1900s)
The modern oil industry is conventionally dated to August 27, 1859, when Colonel Edwin Drake drilled the world’s first successful commercial oil well near Titusville, Pennsylvania, at a depth of 69.5 feet (21.2 meters). This well produced about 25 barrels per day and triggered the world’s first oil boom.
Within a decade, Pennsylvania was producing millions of barrels of oil per year, primarily for kerosene used in lamps (replacing whale oil). John D. Rockefeller founded Standard Oil in 1870 and built a monopoly over refining and distribution that would eventually control 90 percent of US oil refining. Standard Oil was broken up by the US Supreme Court in 1911 into 34 companies, several of which survive today as ExxonMobil, Chevron, and ConocoPhillips.
The internal combustion engine, commercialized by Karl Benz and Gottlieb Daimler in the 1880s, created an insatiable demand for gasoline. Oil replaced coal as the dominant transportation fuel during the early 20th century.
The Age of the Seven Sisters (1920s-1970s)
By the 1920s and 1930s, seven Western oil companies Standard Oil of New Jersey (Exxon), Standard Oil of New York (Mobil), Standard Oil of California (Chevron), Texaco, Gulf Oil, British Petroleum (BP), and Royal Dutch Shell controlled the majority of global oil production, refining, and distribution. They became known as the “Seven Sisters.”
These companies signed the 1928 Achnacarry Agreement (also known as the “As-Is” Agreement), secretly dividing global markets and fixing prices. Their power in the Middle East came through concession agreements with producing nations, under which companies paid royalties but controlled operations entirely.
The OPEC Revolution and Price Shocks (1960s-1980s)
The Organization of the Petroleum Exporting Countries (OPEC) was founded in 1960 by Venezuela, Iraq, Iran, Kuwait, and Saudi Arabia. Its initial goal was to coordinate royalty negotiations with the Western oil majors.
The 1973 Arab Oil Embargo triggered by OPEC Arab members cutting off oil to the US and Western Europe in response to support for Israel during the Yom Kippur War quadrupled oil prices from about $3 to $12 per barrel and exposed the vulnerability of oil-dependent economies. Fuel rationing, long queues at petrol stations, and recession followed across the West.
The 1979 Iranian Revolution and subsequent Iran-Iraq War triggered a second price shock, pushing prices above $35 per barrel by 1980. This spurred massive investment in energy efficiency, North Sea and Alaskan oil development, and the early foundations of the modern renewable energy industry.
Oil Price Collapse and Recovery (1980s-2000s)
Overproduction and falling demand caused oil prices to collapse to under $10 per barrel in 1986. The 1990s saw moderate prices and relative stability, briefly disrupted by the Gulf War (1990-91). The early 2000s saw a new commodity supercycle driven by Chinese industrialization and demand from emerging markets, pushing Brent crude above $140 per barrel by July 2008 a record that stood for many years.
The 2008 global financial crisis crashed demand, sending prices back below $40 before a rapid recovery.
The Shale Revolution and Price War (2010s)
The application of hydraulic fracturing and horizontal drilling to shale formations in the United States triggered one of the most dramatic supply disruptions in oil history. US oil production nearly doubled from about 5 million barrels per day (mb/d) in 2008 to over 13 mb/d by 2019, making the US the world’s largest oil producer, surpassing Saudi Arabia and Russia.
This supply surge contributed to a price crash in 2014-2016, with Brent falling from $115 to below $30. Saudi Arabia, rather than cutting production to defend prices, maintained output in an attempt to squeeze high-cost US shale producers out of the market. The strategy had mixed results many US shale companies went bankrupt, but the industry restructured, became more efficient, and continued to grow.
COVID-19 and the Price Collapse of 2020
The COVID-19 pandemic caused the largest single demand shock in oil history. Global oil demand fell by approximately 9 mb/d in 2020 about 9 percent of pre-pandemic demand. An ill-timed OPEC+ price war between Saudi Arabia and Russia in March 2020 simultaneously caused a supply surge. On April 20, 2020, WTI crude futures briefly traded at negative $37.63 per barrel the first time in history that oil futures went negative as storage capacity became exhausted.
Demand recovered through 2021 and 2022, and Russia’s invasion of Ukraine in February 2022 triggered another price spike, pushing Brent above $120 per barrel as European nations scrambled to replace Russian gas and oil.
5. How Oil and Gas Are Formed
Understanding the origin of oil and gas is fundamental to understanding why they are found where they are, how much there is, and why it took millions of years to create what we are consuming in centuries.
The Organic Origin Theory
The dominant scientific explanation for the origin of petroleum is the biogenic (organic) theory. According to this theory, oil and gas formed from the remains of ancient marine organisms primarily phytoplankton, zooplankton, and algae that lived in shallow seas hundreds of millions of years ago.
When these organisms died, they sank to the seafloor and were buried under layers of sediment. In the absence of oxygen (anoxic conditions), they were not fully decomposed. Instead, over millions of years, heat and pressure from the overlying rock transformed the organic material through a series of chemical reactions.
The Process: From Organism to Hydrocarbon
Stage 1 Deposition and Diagenesis (surface to 1,000 meters, below 50 degrees C):
Organic matter accumulates in fine-grained sedimentary rock (typically shale) known as the source rock. Microbial activity converts some of it to biogenic methane (the same process that produces methane in swamps and landfills). The organic material becomes kerogen a complex, solid organic compound.
Stage 2 Catagenesis (1,000-4,000 meters, 50-150 degrees C, “oil window”):
As burial depth and temperature increase, kerogen thermally cracks into liquid hydrocarbons (crude oil) and wet gas. This is the primary oil-generating zone. Most conventional oil fields formed from source rocks buried to this depth.
Stage 3 Metagenesis (below 4,000 meters, above 150 degrees C, “gas window”):
At greater depths and temperatures, oil is cracked further into dry gas (primarily methane). Shale gas formations are typically at these depths.
Migration and Trapping
Generated oil and gas are less dense than the surrounding water-saturated rock, so they migrate upward through permeable pathways faults, fractures, and permeable rock layers. They continue migrating until they encounter an impermeable barrier (cap rock, such as dense shale, salt, or evaporites) that prevents further upward movement. This creates a petroleum trap where hydrocarbons accumulate in porous reservoir rock.
Types of Petroleum Traps
| Trap Type | Description | Example Fields |
|---|---|---|
| Anticline | Arched rock fold; oil/gas collect at the crest | Most Middle East giant fields |
| Fault trap | Impermeable rock brought against reservoir by faulting | Many North Sea fields |
| Stratigraphic trap | Reservoir pinches out or is sealed by facies change | Athabasca oil sands |
| Salt dome | Salt pierces through strata, creating seal around flanks | Gulf of Mexico, North Sea |
| Combination | Two or more trap types | Prudhoe Bay, Alaska |
The entire process from organic deposition to petroleum trap formation typically takes between 1 million and 650 million years. Most commercially significant oil and gas deposits formed between 30 million and 300 million years ago.
6. Oil and Gas Geology and Reservoir Types
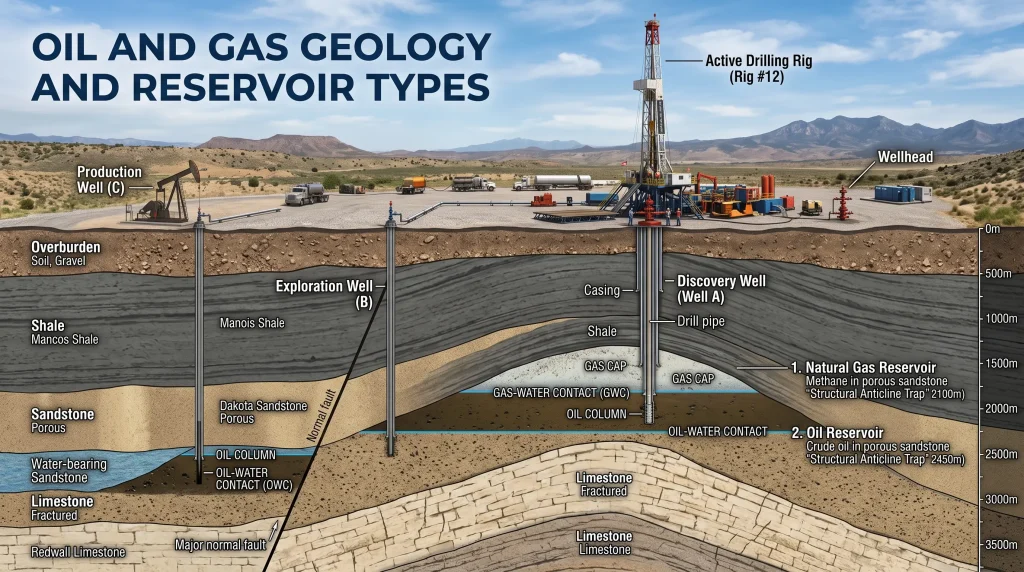
A petroleum system is the combination of source rock, migration pathway, reservoir rock, cap rock (seal), and trap that must all exist together for a viable oil or gas accumulation to form. Geologists and geophysicists spend their careers identifying and characterizing these systems.
Key Elements of a Petroleum System
Source rock: The organic-rich rock in which hydrocarbons generated. Typically a dark, fine-grained shale or mudstone rich in total organic carbon (TOC). The Kimmeridge Clay in the North Sea and the Bakken Shale in North Dakota are famous source rocks.
Reservoir rock: The porous and permeable rock in which oil and gas are stored. Must have sufficient:
- Porosity: The percentage of void space in rock (typically 10-30% in good reservoirs)
- Permeability: The ability of fluid to flow through connected pores (measured in millidarcies or Darcies)
Common reservoir rock types include sandstone, limestone (carbonate), and dolomite.
Cap rock (seal): The impermeable barrier that prevents hydrocarbons from migrating further. Must have very low permeability. Common cap rocks include dense shale, anhydrite, salt, and tight limestone.
Overburden: The rock column above the reservoir that creates the pressure and temperature needed for hydrocarbon generation and helps maintain reservoir pressure.
Conventional vs Unconventional Reservoirs
| Feature | Conventional | Unconventional |
|---|---|---|
| Reservoir rock | Sandstone, limestone | Shale, tight sand, coal seam |
| Porosity | 10-35% | 2-10% |
| Permeability | 1-1,000 millidarcies | 0.001-1 millidarcy |
| Flow to well | Flows naturally | Requires stimulation (fracking) |
| Well type | Vertical | Horizontal + multi-stage fracturing |
| Recovery factor | 20-60% | 5-15% |
| Cost per well | Lower | Higher |
Giant Oil and Gas Fields
A “giant” field contains at least 500 million barrels of ultimately recoverable oil equivalent. A “supergiant” contains more than 5 billion barrels. As of 2024, about 1 percent of all known oil fields account for over 70 percent of global reserves illustrating extreme concentration.
| Field | Country | Estimated Reserves | Discovery Year |
|---|---|---|---|
| Ghawar | Saudi Arabia | 170 billion barrels | 1948 |
| Burgan | Kuwait | 70 billion barrels | 1938 |
| Safaniya | Saudi Arabia | 37 billion barrels | 1951 |
| Rumaila | Iraq | 17 billion barrels | 1953 |
| Ahvaz | Iran | 65 billion barrels | 1958 |
| North Field / South Pars | Qatar / Iran | 1,800 Tcf gas | 1971 / 1990 |
| Urengoy | Russia | 223 Tcf gas | 1966 |
| Kashagan | Kazakhstan | 38 billion barrels | 2000 |
You May Also Like It:
Natural Gas Energy: A Complete Guide to Its Benefits, Drawbacks, and Role in the Modern World
Natural Gas Appliances Guide: Stove, Patio Heater, Water Heater, Tankless Heater & Weber Grill
Oil and Gas Asset Management: Complete Guide to Software and Best Practices
Friction Reducer in Oil and Gas: A Field Guide to How It Works and Why It Matters
7. Oil and Gas Exploration
Exploration is the high-risk, high-reward first phase of the oil and gas lifecycle. The objective is to identify and evaluate potential petroleum traps before committing to the enormous cost of drilling a well. Modern exploration combines remote sensing, geophysics, geochemistry, and advanced computing.
Exploration Methods
Geological Mapping:
The first stage of exploration involves analyzing regional geology through surface mapping, satellite imagery, existing borehole data, and academic research to identify sedimentary basins with the characteristics of a working petroleum system.
Seismic Surveys:
Seismic reflection is the most powerful exploration tool. It works by sending acoustic energy (sound waves) into the earth from explosive charges, vibroseis trucks (on land), or air guns (offshore) and recording the reflected signals at surface receivers (geophones on land, hydrophones offshore). Differences in rock density and elasticity cause seismic waves to reflect at boundaries between rock layers, producing images of subsurface structure.
- 2D seismic: Produces a cross-sectional view along a single line. Used for basin reconnaissance.
- 3D seismic: A dense grid of lines produces a three-dimensional volume image of the subsurface. Standard for field development. Typical cost: $30,000-$100,000 per square kilometer offshore.
- 4D seismic: Repeated 3D surveys over time to monitor how fluids move through a producing reservoir. Used in advanced reservoir management.
Gravity and Magnetic Surveys:
Airborne or marine surveys that measure variations in Earth’s gravitational and magnetic fields. Useful for basin mapping and identifying salt structures and igneous bodies at low cost.
Geochemical Surveys:
Soil gas sampling, sea-bottom sampling, and atmospheric hydrocarbon measurement to detect micro-seeps from subsurface accumulations. Used as a screening tool in new basins.
Electromagnetic Surveys (CSEM):
Controlled-source electromagnetic surveys measure the electrical resistivity of the seafloor. Hydrocarbon-filled rock is more resistive than water-saturated rock, making CSEM a useful tool for de-risking deepwater prospects before drilling.
Exploration Drilling
After seismic data is processed and interpreted, if a geologist believes there is a viable prospect, the operator may decide to drill an exploration (wildcat) well. Wildcat wells are expensive:
- Onshore well: $1-5 million depending on depth and location
- Offshore shallow water well: $10-30 million
- Deepwater well: $100-200 million or more
- Ultra-deepwater well: $150-300 million
The global average success rate for exploration wells is roughly 1 in 5 meaning about 20 percent of wildcat wells find commercial hydrocarbons. Success rates vary significantly with geology and data quality.
When a well discovers hydrocarbons, it is called a discovery. The next step is appraisal drilling additional wells to define the size, producibility, and fluid properties of the accumulation. Only after appraisal does the operator make a final investment decision (FID) to develop the field.
8. Drilling Technology and Well Types
Drilling an oil or gas well is one of the most complex and technically demanding operations in industrial engineering. Modern wells can reach depths of more than 12 kilometers, deviate horizontally for 15 kilometers from the surface location, and must be drilled and cased precisely to protect freshwater aquifers and prevent blowouts.
The Rotary Drilling System
Modern oil and gas wells are drilled using a rotary drilling system. The main components are:
Drill string: A column of steel pipes (drill pipe) connected in series and rotated from the surface. At the bottom is the Bottom Hole Assembly (BHA), which includes drill collars (heavy steel tubes that add weight on the bit), stabilizers, and measurement tools.
Drill bit: The cutting tool at the bottom of the drill string. Two main types:
- Roller cone (tricone) bits: Three cones with teeth that crush and gouge rock. Used in softer formations.
- Polycrystalline Diamond Compact (PDC) bits: Fixed cutters with synthetic diamond blades that shear rock. More efficient and durable in harder formations. Now dominant in the industry.
Drilling fluid (mud): A carefully engineered fluid pumped down the drill string and back up the annulus (space between drill string and wellbore). Functions include:
- Cooling and lubricating the bit
- Carrying rock cuttings to the surface for disposal and analysis
- Maintaining wellbore stability and preventing collapse
- Controlling subsurface pressure to prevent blowouts
Drilling fluid is either water-based mud (WBM), oil-based mud (OBM, better for complex wells but more expensive to dispose of), or synthetic-based mud (SBM).
Derrick/Mast: The steel tower above the wellbore that supports the weight of the drill string and casing.
Rotary table or top drive: Rotates the drill string. Modern rigs mostly use top drives for more flexibility.
Blowout Preventer (BOP): A critical safety device installed at the wellhead (on the seafloor in offshore operations) that can seal the wellbore in case of an unexpected pressure surge (kick) from the formation. The Deepwater Horizon disaster in 2010 resulted from BOP failure.
Well Types
Vertical wells: Drilled straight down. Simple and lower cost. Standard until the 1990s.
Directional wells: Deviated from vertical at a planned angle to reach a target that is not directly below the surface location. Used to reach reservoirs under obstacles (buildings, populated areas, bodies of water) or to drill multiple wells from a single platform.
Horizontal wells: Deviated to nearly 90 degrees to run along the reservoir layer. Massively increase contact between the wellbore and the producing formation. Essential for tight and shale reservoirs.
Extended reach wells (ERD): Horizontal wells with very long departures from the vertical, sometimes exceeding 15 kilometers. Used to access offshore reservoirs from onshore locations.
Multilateral wells: Single well bore with multiple branches extending into different parts of the reservoir.
SAGD wells (Steam-Assisted Gravity Drainage): Twin horizontal wells used in oil sands extraction.
Casing and Well Completion
After drilling to a planned depth, steel casing pipe is run into the wellbore and cemented in place to isolate formations, protect freshwater aquifers, and provide a safe conduit for produced fluids. Multiple casing strings are installed progressively as drilling deepens:
- Conductor casing: Large diameter, shallow; prevents borehole collapse near surface
- Surface casing: Protects freshwater aquifers
- Intermediate casing: Isolates abnormally pressured zones
- Production casing (liner): The final casing through the reservoir
Well completion refers to the operations performed to prepare a drilled well for production, including perforating (creating holes in the casing to allow hydrocarbons to enter), installing production tubing, and in unconventional wells, hydraulic fracturing.
Rig Types
| Rig Type | Water Depth | Location |
|---|---|---|
| Land rig | N/A | Onshore |
| Jack-up rig | Up to 150m | Shallow offshore |
| Semi-submersible | 300-3,000m | Deepwater |
| Drillship | 1,000-3,500m+ | Ultra-deepwater |
| Platform rig | Fixed; shallow | Offshore platform |
| Tender assist rig | Up to 500m | Offshore |
The world’s most powerful drillships (such as those operated by Transocean, Valaris, and Noble) can drill to depths exceeding 12,000 meters below the seafloor in water depths of more than 3,500 meters.
9. Oil and Gas Production
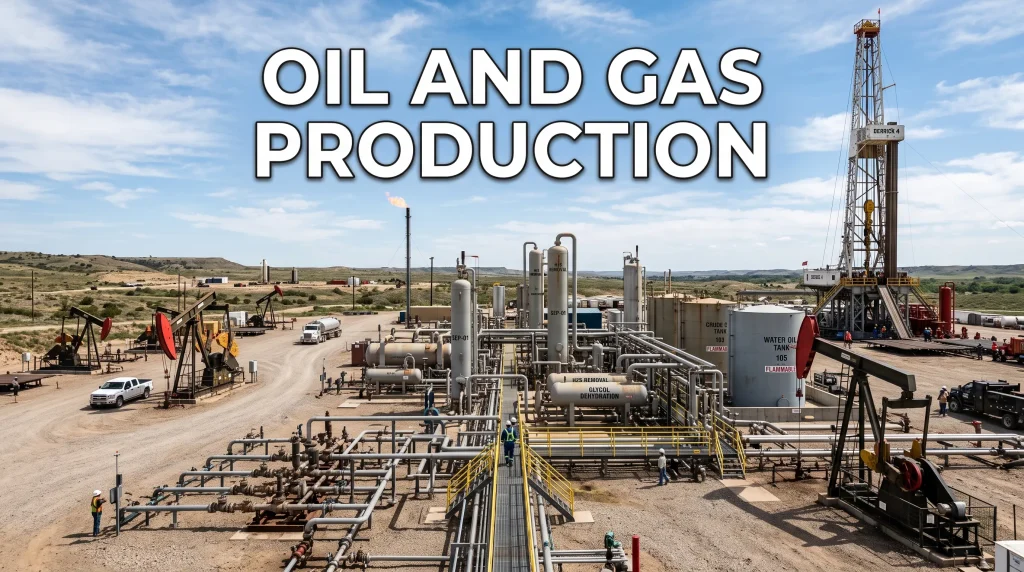
Once a well is completed, production begins. The goal of production engineering is to maximize the recovery of hydrocarbons from the reservoir in a safe, economic, and environmentally responsible manner over the field’s productive life.
Primary Recovery
In the initial production phase, reservoir pressure is typically sufficient to push hydrocarbons into the wellbore and to the surface. This natural drive can come from:
- Solution gas drive: Gas dissolved in oil expands and pushes oil toward the well as pressure drops.
- Gas cap drive: Free gas above the oil expands and displaces oil downward and toward wells.
- Water drive: Water from an adjacent aquifer encroaches into the reservoir, displacing oil upward toward wells.
- Gravity drainage: In steeply dipping reservoirs, oil drains downward under gravity.
Primary recovery typically yields 10-30 percent of the original oil in place (OOIP).
Secondary Recovery: Enhanced Production
When reservoir pressure declines and natural drive mechanisms weaken, secondary recovery methods are applied:
Water injection (waterflooding): Water is injected into injection wells to maintain reservoir pressure and sweep oil toward production wells. This is the most widely used secondary recovery method globally, increasing recovery to 20-40 percent of OOIP.
Gas injection: Natural gas, CO2, or nitrogen is injected to maintain pressure and improve oil displacement. CO2 injection is particularly effective because CO2 dissolves into oil, reducing its viscosity and swelling it to improve displacement.
Tertiary Recovery: Enhanced Oil Recovery (EOR)
EOR methods are applied when primary and secondary recovery have been exhausted. They can increase recovery to 30-60 percent or more:
| EOR Method | How It Works | Suitable For |
|---|---|---|
| CO2 flooding | CO2 dissolves into oil, reduces viscosity, swells oil | Light to medium oil |
| Steam injection | Heat reduces viscosity of heavy oil | Heavy oil, oil sands |
| Polymer flooding | Thickened water improves sweep efficiency | Medium viscosity oil |
| Surfactant flooding | Reduces interfacial tension, releases trapped oil | Light to medium oil |
| SAGD | Twin horizontal wells; steam injected in upper well | Oil sands (Canada) |
| Microbial EOR | Microbes produce gases/acids to improve recovery | Various |
Global EOR production is estimated at approximately 2.5 mb/d, predominantly from steam injection in California and Canada and CO2 flooding in Texas (EIA, 2023).
Well Testing and Production Monitoring
Throughout the producing life of a well, production engineers monitor:
- Flow rates of oil, gas, and water
- Wellhead pressure and temperature
- Gas-oil ratio (GOR)
- Water cut (percentage of produced fluid that is water)
- Downhole conditions through permanent downhole gauges
Production decline is inevitable as reservoir pressure drops and water cut increases. Advanced analytics and machine learning are increasingly used to optimize production, predict failures, and schedule workovers (remedial well operations).
10. Onshore vs Offshore Operations
The oil and gas industry operates in two fundamentally different environments onshore (land) and offshore (sea) each with distinct engineering, logistical, environmental, and economic characteristics.
Onshore Operations
Onshore operations access oil and gas beneath land surfaces. They account for roughly 70 percent of global oil production and are generally less expensive and less technically demanding than offshore.
Advantages:
- Lower drilling and infrastructure costs
- Easier access for equipment and personnel
- Simpler logistics for processing and transport
- Faster regulatory approvals (in most jurisdictions)
- No marine weather limitations
Challenges:
- Land access and surface rights negotiations
- Environmental sensitivity in populated or ecologically important areas
- Produced water disposal (major issue in unconventional operations)
- Flaring regulations for associated gas
Major onshore producing regions:
- Middle East (Saudi Arabia, Iraq, UAE, Kuwait)
- Russia (West Siberia, Volga-Ural)
- USA (Permian Basin, Bakken, Eagle Ford)
- Canada (Alberta oil sands)
- Venezuela (Orinoco Belt)
- Iran
Offshore Operations
Offshore operations extract oil and gas from beneath the ocean floor. They supply approximately 30 percent of global oil production and a significant portion of gas production.
Advantages:
- Access to resources unavailable from land
- Avoids land acquisition and surface conflicts
- Many giant, high-quality reservoirs located offshore
Challenges:
- Much higher capital costs (platforms, subsea infrastructure)
- Harsh weather: waves, currents, corrosion, hurricanes
- Complex logistics: helicopter transport, supply vessels
- Longer development timelines (5-10 years from discovery to first oil)
- Higher risk of catastrophic incidents (Deepwater Horizon, Piper Alpha)
Offshore Installation Types
| Installation Type | Water Depth | Description |
|---|---|---|
| Fixed steel platform | Up to 500m | Jacket piled to seabed |
| Concrete gravity-based structure (GBS) | Up to 300m | Concrete structure sits on seabed; common in North Sea |
| Compliant tower | 300-900m | Flexible, slender steel tower |
| Tension Leg Platform (TLP) | 300-1,500m | Floating platform moored by vertical tendons |
| SPAR platform | 600-3,000m | Deep-draft floating cylinder |
| Semi-submersible production unit | 500-3,000m | Pontoon-based floating facility |
| FPSO (Floating Production, Storage, and Offloading) | Any depth | Most flexible; no export pipeline needed |
| Subsea tieback | Any depth | Wells on seabed connected to existing host facility |
FPSOs have become the dominant solution for new deepwater and ultra-deepwater developments worldwide due to their flexibility and ability to operate without fixed pipelines.
11. Oil Refining: How Crude Becomes Products
Crude oil as it comes from the ground is of limited direct use. It must be refined separated into its components and chemically transformed to produce the specific products that consumers and industry require. Oil refining is one of the world’s largest industrial processes.
The Refining Process
Step 1: Desalting
Crude oil arriving at the refinery typically contains water, salts, and sediment that must be removed to prevent corrosion and fouling of equipment. Crude is mixed with fresh water and treated with an electric field to coalesce and separate the water droplets.
Step 2: Atmospheric Distillation (Crude Distillation Unit – CDU)
The heart of every refinery. Crude oil is heated in a furnace to approximately 350-400 degrees Celsius and fed into a tall distillation column (up to 60 meters tall). Different hydrocarbon fractions condense at different temperatures (their boiling points) as they rise up the column and are drawn off as “cuts” or “fractions.”
| Fraction | Boiling Range (degrees C) | Carbon Atoms | Primary Use |
|---|---|---|---|
| Liquefied Petroleum Gas (LPG) | Below 40 | C1-C4 | Fuel, petrochemical feedstock |
| Light naphtha | 40-70 | C5-C7 | Gasoline blending, petrochemicals |
| Heavy naphtha | 70-180 | C7-C9 | Reforming to gasoline |
| Kerosene/Jet fuel | 150-250 | C10-C14 | Aviation fuel, heating |
| Gas oil/Diesel | 200-360 | C15-C25 | Road transport, heating |
| Atmospheric residue | Above 360 | C25+ | Further processing, fuel oil |
Step 3: Vacuum Distillation
The atmospheric residue (bottoms from the CDU) is further distilled under vacuum (reduced pressure) to prevent thermal cracking. This produces:
- Vacuum gas oil (VGO) feedstock for cracking units
- Vacuum residue the heaviest fraction, processed into asphalt or via coking
Step 4: Conversion Units
Modern refineries are not satisfied with the product mix from distillation alone. They use conversion processes to upgrade lower-value heavy fractions into higher-value lighter products:
- Fluid Catalytic Cracking (FCC): Breaks heavy gas oil into gasoline and other lighter products using a catalyst. One of the most important refinery processes.
- Hydrocracking: Uses hydrogen under high pressure to crack heavy oil into diesel and jet fuel. Produces very clean, low-sulfur products.
- Coking (Delayed coker or fluid coker): Thermally cracks the heaviest vacuum residue into lighter products plus petroleum coke (a solid carbon product used in aluminum smelting and as fuel).
- Catalytic reforming: Converts naphtha into high-octane reformate (for gasoline blending) and produces hydrogen as a byproduct.
Step 5: Treating and Blending
Products are desulfurized (hydrotreated), dewaxed, and blended to meet precise quality specifications before being shipped to consumers.
Refinery Complexity
A refinery’s complexity is measured by the Nelson Complexity Index (NCI). A simple “topping” refinery with only distillation has an NCI of 1. A complex refinery with coking, FCC, and hydrocracking may have an NCI of 12-15 or higher. Complex refineries process more heavy crude, achieve higher margins, and are more profitable.
Global refining capacity as of 2024 is approximately 100 million barrels per day, with the largest refining centers in Asia-Pacific (China, India, South Korea, Japan), the Middle East, and the United States.
12. Natural Gas Processing and Treatment
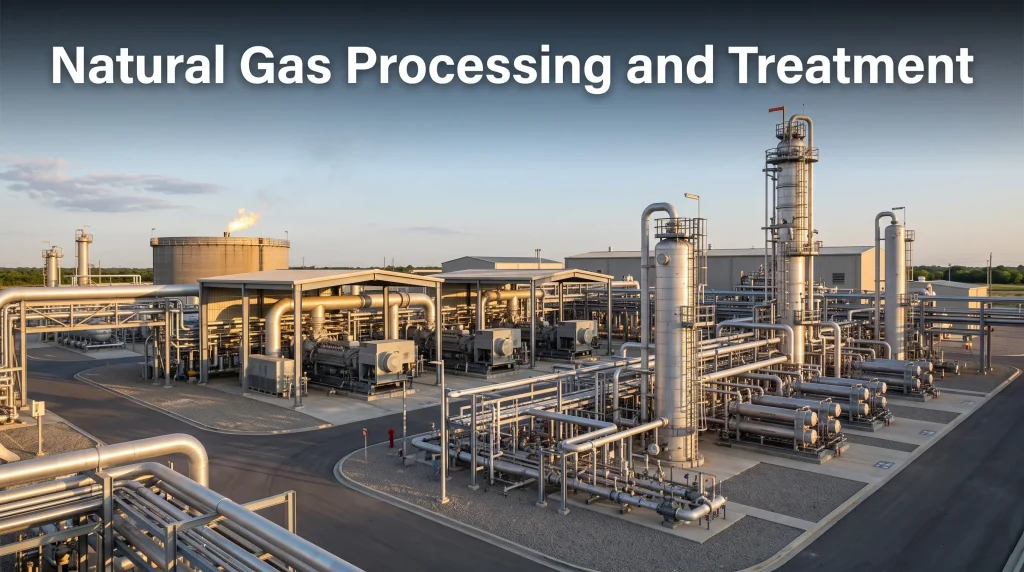
Natural gas as produced from the wellhead (“wellhead gas” or “wet gas”) contains a mixture of methane, heavier hydrocarbons (ethane, propane, butane, pentane+), water vapor, carbon dioxide, hydrogen sulfide, nitrogen, and mercury. Before it can be injected into a pipeline or sold, it must be processed.
Gas Processing Steps
Step 1: Separation
At the wellhead or a field gathering facility, oil, water, and gas are separated using two-phase or three-phase separators. Gas then flows to the gas plant.
Step 2: Gas Sweetening (Acid Gas Removal)
Sour gas containing hydrogen sulfide (H2S) and carbon dioxide (CO2) must be treated before pipeline injection. The most common method is amine gas treating, in which the gas is contacted with an amine solution (such as MEA, DEA, or MDEA) that selectively absorbs H2S and CO2. The amine is regenerated by heating, releasing concentrated H2S and CO2.
The H2S removed is converted to elemental sulfur via the Claus process a valuable byproduct sold to the fertilizer, chemical, and rubber industries.
Step 3: Dehydration
Water vapor must be removed to prevent the formation of ice-like gas hydrates in pipelines and corrosion. The most common method is glycol dehydration, in which the gas contacts liquid triethylene glycol (TEG) that absorbs water. Molecular sieve dehydration is used when very low water content is required (as for LNG production).
Step 4: Natural Gas Liquid (NGL) Recovery
Heavier hydrocarbons (ethane, propane, butane, pentane+) are recovered from the gas stream. These NGLs are more valuable as chemical feedstocks or LPG than if left in the gas stream. Recovery methods include:
- Refrigeration/chilling
- Lean oil absorption
- Turbo-expander process (most common; achieves very high ethane recovery)
Step 5: Sales Gas Specification
Residue gas (mostly methane) is compressed and metered for pipeline injection. It must meet the gas specification set by the pipeline operator, including limits on water content, H2S, CO2, heating value, Wobbe index, and oxygen content.
13. Petroleum Products and Their Uses
The refining of crude oil and the processing of natural gas produce a remarkable range of products that underpin virtually every aspect of modern civilization.
Transportation Fuels
| Product | Primary Use | Global Volume (2023 estimate) |
|---|---|---|
| Gasoline (petrol) | Passenger cars, motorcycles | ~26 mb/d |
| Diesel/Gas oil | Trucks, buses, trains, ships, generators | ~28 mb/d |
| Jet fuel (Avtur) | Commercial aviation | ~7 mb/d |
| Marine fuel oil | Shipping | ~4 mb/d |
| LPG | Vehicles (autogas), cooking, heating | ~10 mb/d |
Aviation relies entirely on jet fuel with no scalable alternative available at present even with significant investment in Sustainable Aviation Fuel (SAF), which accounted for less than 0.5 percent of global jet fuel use in 2023 (IATA).
Non-Fuel Petroleum Products
| Product | Uses |
|---|---|
| Naphtha | Petrochemical feedstock, solvent |
| Lubricating oils | Engine oil, industrial lubricants |
| Paraffin wax | Candles, packaging, pharmaceuticals |
| Bitumen/Asphalt | Road paving, waterproofing |
| Petroleum coke | Aluminum smelting, cement kilns, power generation |
| Feedstocks (ethylene, propylene) | Plastics, synthetic fibers, rubber, fertilizers |
| White spirits | Cleaning solvents, paints, printing inks |
| Medicinal paraffin | Pharmaceutical, cosmetics |
Approximately 12-15 percent of global oil consumption goes to non-energy uses (feedstocks for chemicals, plastics, pharmaceuticals, and materials) that cannot easily be electrified or replaced by renewables. This “lock-in” of oil demand is one reason peak oil demand forecasts are uncertain.
14. Liquefied Natural Gas (LNG)
LNG is natural gas that has been cooled to approximately negative 162 degrees Celsius (-160 degrees C), at which point it condenses into a liquid with a volume about 600 times smaller than in its gaseous state. This dramatic volume reduction makes it economical to ship natural gas in specialized tankers to markets far from producing regions crossing oceans that no pipeline could cross.
The LNG Value Chain
Liquefaction: Gas from producing fields is treated and purified, then chilled through a series of heat exchangers using refrigerant cycles (propane, mixed refrigerant) until it liquefies. The refrigeration process requires enormous amounts of power. LNG liquefaction facilities (trains) are among the largest and most complex industrial plants ever built, costing $10-50 billion for large projects.
LNG tankers: Cryogenic vessels that maintain cargo at -162 degrees C. Modern large LNG carriers have capacities of 125,000-266,000 cubic meters (m3). The largest class, Q-Max carriers operated by Qatar, hold 266,000 m3. The global LNG tanker fleet numbered approximately 700 vessels in 2024, with more on order.
Receiving terminals: Import terminals receive LNG tankers, store LNG in insulated tanks, and regasify it for injection into national gas pipelines.
Global LNG Trade
Global LNG trade reached 404 million tonnes per year (mt/y) in 2023 (GIIGNL), up from less than 200 mt/y in 2010. Russia’s invasion of Ukraine in 2022 triggered a massive restructuring of LNG trade flows as European buyers replaced Russian pipeline gas with LNG.
| Top LNG Exporters (2023) | Volume (mt/y approximate) |
|---|---|
| Australia | 80 |
| Qatar | 78 |
| USA | 88 |
| Russia | 32 |
| Malaysia | 28 |
| Nigeria | 17 |
| Top LNG Importers (2023) | Volume (mt/y approximate) |
|---|---|
| Japan | 70 |
| China | 71 |
| South Korea | 44 |
| India | 22 |
| France | 21 |
| Germany (new terminal 2022-23) | 18 |
The US overtook Australia and Qatar to become the world’s largest LNG exporter in 2023, driven by rapid expansion of Gulf Coast liquefaction capacity (Sabine Pass, Corpus Christi, Calcasieu Pass).
LNG prices are highly volatile, as demonstrated by European spot prices exceeding $70/MMBtu in August 2022 (compared to a historical average of $5-10/MMBtu in Asia), driven by post-Ukraine supply panic.
15. Compressed Natural Gas (CNG) and LPG
Compressed Natural Gas (CNG)
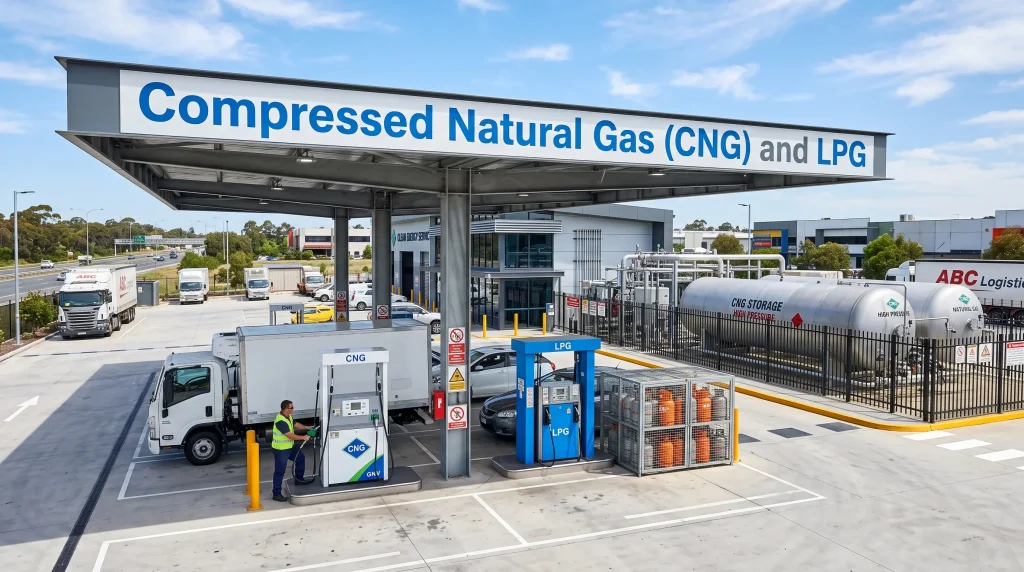
CNG is natural gas compressed to pressures of 200-250 bar and stored in high-pressure cylinders. It retains its gaseous state and has a much lower energy density than LNG, making it suitable for shorter-range applications where a refueling infrastructure is nearby.
CNG is used primarily for:
- Road transport: Buses, trucks, taxis, and refuse vehicles in urban areas with CNG fueling infrastructure
- Industrial fuel: Factories and commercial buildings near gas pipelines that use CNG as a backup or primary fuel
Countries with large CNG vehicle fleets include Iran (over 4 million CNG vehicles), China, Pakistan, India, Argentina, and Brazil.
Liquefied Petroleum Gas (LPG)
LPG consists primarily of propane and butane, which liquefy at relatively low pressures (6-10 bar) at ambient temperature. LPG is a byproduct of both oil refining and natural gas processing.
LPG uses include:
- Cooking fuel: Over 300 million households globally use LPG for cooking, particularly in developing nations. India’s PMUY scheme distributed LPG connections to 80 million households below the poverty line.
- Heating: Distributed as bottled gas where no gas pipeline exists
- Automotive fuel (autogas): LPG is the third most common vehicle fuel globally after gasoline and diesel
- Industrial use: Chemical feedstock, aerosol propellant, forklift fuel
- Agricultural use: Crop drying, greenhouse heating
Global LPG production is approximately 350 million tonnes per year (2023), with the US, Saudi Arabia, and Russia being the largest producers.
16. Oil and Gas Pipelines
Pipelines are the arteries of the oil and gas industry the safest, most efficient, and most economical way to transport large volumes of oil and gas over land. The world’s pipeline network stretches millions of kilometers, forming an invisible infrastructure system as critical as the internet or road network.
Pipeline Types
Gas transmission pipelines: High-pressure (60-100 bar), large diameter (24-60 inches), spanning hundreds to thousands of kilometers. Examples include the Trans-Siberian Pipeline (Russia to Europe), the West-East Pipeline (China), and the Trans-Adriatic Pipeline (TAP).
Crude oil pipelines: Transport crude from producing fields to refineries or export terminals. Operate at lower pressures than gas pipelines. Examples: Trans-Alaska Pipeline System (TAPS), Druzhba (Russia to Eastern Europe), Keystone Pipeline System.
Products pipelines: Transport refined products (gasoline, diesel, jet fuel) from refineries to distribution terminals.
Gas distribution pipelines: Lower-pressure pipelines that deliver gas from transmission systems to homes and businesses. Typically 4-16 bar pressure in medium-pressure networks, below 75 mbar in low-pressure consumer lines.
Offshore pipelines: Subsea pipelines connecting offshore platforms to onshore terminals or between platforms. Must withstand seawater pressure, corrosion, and movement. The world’s longest subsea pipeline is the Langeled pipeline (Norway to UK), stretching 1,166 km.
Pipeline Economics
Pipelines have very high upfront capital costs but very low operating costs per unit of throughput. A large crude oil pipeline (40 inches diameter, 1,000 km) might cost $2-5 billion to build but can transport hundreds of thousands of barrels per day for 40-50 years.
| Transport Method | Cost (per barrel per 1,000 km) |
|---|---|
| Pipeline (crude) | $1.50-$4 |
| Rail (crude) | $5-$15 |
| Truck (crude) | $10-$30 |
| VLCC tanker (crude, transoceanic) | $0.50-$2 |
The strategic importance of pipelines makes them geopolitical assets. Russia’s Gazprom has used its control of gas pipelines as political leverage for decades. The Nord Stream 2 pipeline (Russia-Germany under the Baltic Sea) became a major geopolitical flashpoint before and after Russia’s 2022 invasion of Ukraine. Both Nord Stream 1 and Nord Stream 2 were sabotaged in September 2022.
Pipeline Safety and Integrity
Pipeline failures can cause fires, explosions, environmental contamination, and deaths. Pipeline integrity management programs use:
- Inline inspection tools (“smart pigs”): Instrumented devices run through pipelines to detect corrosion, cracks, and deformations
- Cathodic protection: Electrochemical protection against corrosion
- Leak detection systems: Pressure and flow monitoring, computational pipeline monitoring (CPM)
- Hydrotesting: Pressure testing with water to verify integrity
- Regular inspection and maintenance
The US has the world’s most extensive pipeline network approximately 2.6 million miles (4.2 million km) of pipelines of all types (PHMSA). Pipeline transport has a safety record significantly better than road or rail per unit of energy transported.
17. Oil Tankers and Maritime Transport
The oil and gas industry depends heavily on maritime transport for moving crude oil, petroleum products, and LNG between producing regions and consuming markets. The global tanker fleet is one of the most capital-intensive segments of shipping.
Crude Oil Tanker Classes
| Class | Deadweight Tonnage (DWT) | Barrel Capacity | Typical Routes |
|---|---|---|---|
| ULCC (Ultra Large Crude Carrier) | 320,000-550,000 | 2-4 million bbl | Middle East to Asia |
| VLCC (Very Large Crude Carrier) | 200,000-320,000 | 1.5-2.5 million bbl | Middle East to Asia/Europe |
| Suezmax | 120,000-200,000 | 0.8-1.2 million bbl | West Africa to US/Europe |
| Aframax | 80,000-120,000 | 0.5-0.8 million bbl | Regional trades |
| Panamax | 60,000-80,000 | 0.4-0.6 million bbl | Americas, North Sea |
| Handysize | 25,000-45,000 | 0.15-0.3 million bbl | Short-haul, small ports |
Key Shipping Chokepoints
The strategic importance of oil shipping routes creates geopolitical vulnerabilities at narrow straits and canals through which large portions of global oil trade must pass:
| Chokepoint | Location | Daily Oil Transit (mb/d, 2022) |
|---|---|---|
| Strait of Hormuz | Between Iran, Oman, and UAE | 21 (20% of global trade) |
| Strait of Malacca | Between Malaysia and Indonesia | 16 |
| Suez Canal | Egypt | 9 |
| Bab el-Mandeb | Yemen/Djibouti | 8.8 |
| Turkish Straits | Istanbul, Turkey | 3 |
| Cape of Good Hope | South Africa | Bypass route |
| Danish Straits | Denmark | 3 (Russia Baltic exports) |
The Strait of Hormuz is the world’s most critical oil chokepoint. Any closure would immediately affect global oil supply and prices, given that Saudi Arabia, Iraq, UAE, Kuwait, Iran, and Qatar all export through it. There is no cost-effective bypass for most producers.
Houthi attacks on commercial shipping in the Red Sea and Bab el-Mandeb from late 2023 forced tankers to divert around the Cape of Good Hope, significantly increasing voyage times and freight costs.
18. OPEC, OPEC+, and Global Oil Markets
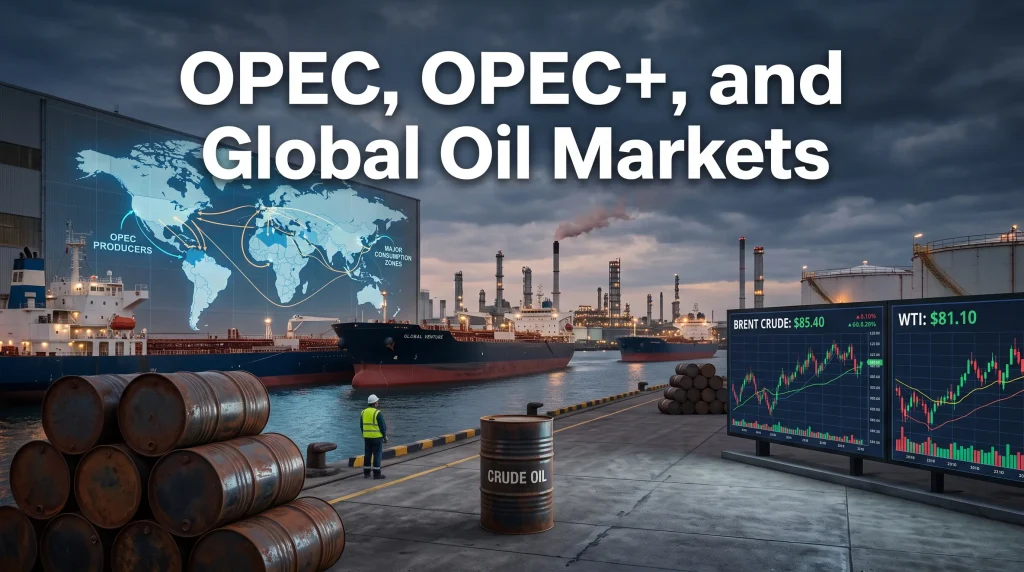
No understanding of the global oil industry is complete without understanding OPEC the Organization of the Petroleum Exporting Countries and the expanded OPEC+ alliance that now includes Russia and other major producers.
OPEC
OPEC was founded in Baghdad in September 1960 by five founding members: Venezuela, Iraq, Iran, Kuwait, and Saudi Arabia. The organization’s stated objective is to “coordinate and unify the petroleum policies of its member countries and ensure the stabilization of oil markets.”
Current OPEC members (as of 2025): Saudi Arabia, Iraq, Iran, UAE, Kuwait, Libya, Nigeria, Gabon, Congo, Equatorial Guinea, and Algeria. Venezuela is a member but produces negligible volumes due to economic collapse.
OPEC collectively holds approximately 79 percent of the world’s proven oil reserves and accounted for about 36-38 percent of global oil production in 2023-24.
OPEC+
In 2016, following the oil price crash of 2014-2016, OPEC formed a broader alliance with non-OPEC producers to coordinate production more effectively. The group which includes Russia, Kazakhstan, Oman, Azerbaijan, Mexico, Malaysia, and others became known as OPEC+ The expanded group controls over 55 percent of global oil production and over 90 percent of proven reserves.
OPEC+ manages production through a system of quotas assigned to each member country. These quotas are negotiated and regularly adjusted. Key decisions:
- November 2016: OPEC+ formed, 1.8 mb/d cuts agreed to support prices after 2014-16 crash
- March 2020: Saudi Arabia-Russia price war; production increased amid COVID demand collapse
- April 2020: Historic 9.7 mb/d cut agreed as COVID crushed demand
- October 2022: OPEC+ cut 2 mb/d amid pressure from Western governments
- 2023-24: Saudi Arabia implemented unilateral additional voluntary cuts
Saudi Arabia’s Role
Saudi Arabia is the de facto leader of OPEC and possesses the world’s largest spare production capacity the ability to increase output quickly. This spare capacity (estimated at 2-3 mb/d as of 2024) gives Saudi Arabia and OPEC significant influence over global oil prices, as oil markets price in the possibility of Saudi production changes.
Saudi Aramco, the Saudi national oil company, is the world’s most profitable company. It reported a net income of $161 billion in 2022 more than Apple, Microsoft, and Google combined that year.
OPEC’s Declining Market Share
OPEC’s market share has been eroded by the US shale revolution. The US produced over 13 mb/d in 2023, more than any other country in history. OPEC faces a long-term strategic challenge: if global oil demand peaks and declines, which producers will be the “last man standing” and which will be left with stranded reserves?
19. Oil Pricing: Brent, WTI, and Dubai Crude
Oil is traded on commodity markets and priced in US dollars, which gives the US dollar its status as the world’s dominant reserve currency (petrodollar system). Understanding how oil is priced requires understanding the benchmark system, futures markets, and the many factors that influence prices.
The Benchmark System
Because oil is not a single homogeneous commodity (light sweet crude is different from heavy sour crude), the industry uses a small number of benchmark crudes as price references, with differentials applied for other grades.
Brent Crude: The most important global oil price benchmark. Priced on the Intercontinental Exchange (ICE). Originally based on oil produced from the Brent field in the North Sea, it now represents a blend of crude from multiple North Sea fields (Brent, Forties, Oseberg, Ekofisk, Troll together known as BFOET). Over two-thirds of global crude trade is priced off Brent.
WTI (West Texas Intermediate): The primary US benchmark. Traded on the New York Mercantile Exchange (NYMEX). Physical delivery at Cushing, Oklahoma a landlocked storage hub, which can cause pricing anomalies (as seen in April 2020 when storage was full and WTI briefly went negative).
Dubai/Oman: The benchmark for medium sour crude sold to Asian markets, particularly from the Middle East. WTI typically trades at a premium to Brent (when US pipelines and export infrastructure are tight, it trades at a discount) and Brent at a premium to Dubai/Oman.
What Moves Oil Prices?
Oil prices are determined by the interaction of supply and demand, but a large number of factors influence both:
Supply factors:
- OPEC+ production decisions and compliance
- US shale production growth
- Geopolitical disruptions (war, sanctions, unrest in producing countries)
- Natural disasters affecting production (hurricanes in Gulf of Mexico)
- Investment levels in new exploration and production
- Technological changes (EOR, shale productivity)
Demand factors:
- Global economic growth (GDP growth correlates strongly with oil demand)
- Chinese economic activity (China is the world’s largest oil importer)
- Transportation demand (vehicle sales, aviation activity)
- Weather (extreme cold increases heating oil demand)
- Fuel efficiency standards (reduce demand per unit of economic activity)
- Electric vehicle penetration (reduces gasoline demand)
Financial factors:
- USD exchange rate (oil is priced in dollars; a weaker dollar raises oil prices)
- Speculative positioning by financial traders (funds, hedge funds)
- Interest rates (higher rates increase the cost of holding oil inventories)
- Options market (gamma effects, structured products)
Geopolitical risk premium:
Oil markets price in the risk of supply disruptions from geopolitical events. The “risk premium” embedded in prices can add $5-20 per barrel during periods of tension.
Historical Oil Price Milestones
| Year | Event | Price (Brent, approx.) |
|---|---|---|
| 1973 | Arab oil embargo | $12 (from $3) |
| 1980 | Iran-Iraq War | $35 |
| 1986 | OPEC overproduction | $10 |
| 1998 | Asian financial crisis | $10 |
| 2008 | Commodity supercycle peak | $147 |
| 2009 | Financial crisis demand crash | $34 |
| 2014 | Pre-crash peak | $115 |
| 2016 | Shale overproduction trough | $27 |
| 2020 | COVID-19 demand collapse | $18 (WTI briefly -$37) |
| 2022 | Russia-Ukraine war | $128 |
| 2024 | OPEC+ cuts, moderate demand | $75-90 range |
20. Global Oil and Gas Reserves
Oil and gas reserves are classified by their certainty and commercial recoverability. Understanding the difference between resource categories is essential for evaluating industry claims about how much oil and gas the world has.
Reserve Classification
The petroleum industry uses two main classification systems:
SPE-PRMS (Society of Petroleum Engineers Petroleum Resources Management System): The industry standard globally.
SEC Rules: Used by US-listed companies for financial reporting. More conservative and prescriptive than SPE-PRMS.
Main Categories:
| Category | Definition |
|---|---|
| Proved (1P) | At least 90% probability of recovery under current conditions |
| Proved + Probable (2P) | At least 50% probability; the “best estimate” used for most analysis |
| Proved + Probable + Possible (3P) | At least 10% probability; optimistic upside case |
| Contingent Resources | Potentially recoverable but not yet commercial (no FID, technical issues) |
| Prospective Resources | Estimated to exist in undiscovered accumulations (speculative) |
Global Proved Reserves
According to BP Statistical Review 2023 and OPEC data:
Global proved oil reserves (end 2022): Approximately 1,700 billion barrels
Reserves-to-Production ratio (R/P): ~47 years at current production rates
| Country | Proved Oil Reserves (billion barrels) | % of World |
|---|---|---|
| Venezuela | 303 | 17.5% |
| Saudi Arabia | 268 | 15.5% |
| Iran | 210 | 12.1% |
| Iraq | 145 | 8.4% |
| Russia | 80 | 4.6% |
| Kuwait | 102 | 5.9% |
| UAE | 111 | 6.4% |
| USA | 68 | 3.9% |
| Libya | 48 | 2.8% |
| Nigeria | 37 | 2.1% |
Caution on reserve data: Many OPEC members’ reserve figures are self-reported and were dramatically revised upward in the 1980s when OPEC quotas were linked to reserves creating a well-documented incentive to overstate. Venezuela’s reserves include vast volumes of heavy oil that require significant upgrading and may not be economic at all prices.
Global proved natural gas reserves (end 2022): Approximately 188 trillion cubic meters (tcm)
| Country | Proved Gas Reserves (tcm) | % of World |
|---|---|---|
| Russia | 37.4 | 19.9% |
| Iran | 33.2 | 17.7% |
| Qatar | 23.8 | 12.6% |
| Turkmenistan | 13.6 | 7.2% |
| USA | 12.6 | 6.7% |
| Saudi Arabia | 9.4 | 5.0% |
| UAE | 5.9 | 3.1% |
21. Shale Oil and Gas: The Fracking Revolution
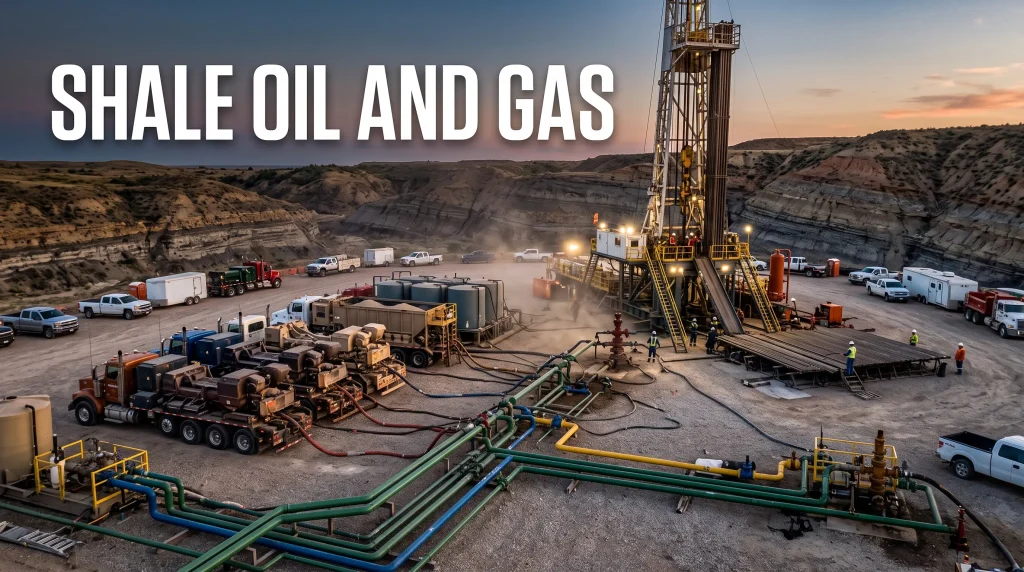
The development of hydraulic fracturing combined with horizontal drilling transformed the United States from a declining oil and gas producer into the world’s largest and in the process reshaped global energy markets, OPEC strategy, and geopolitics.
What Is Hydraulic Fracturing?
Hydraulic fracturing (commonly called “fracking” or “fracing” in the industry) is a well stimulation technique used to extract oil and gas from low-permeability rock formations primarily shale that would not flow naturally to a well.
The process involves:
- Drilling a horizontal well into the target shale formation (typically at depths of 1,500-4,500 meters)
- Pumping a high-pressure mixture of water, sand (proppant), and chemical additives into the wellbore
- The pressure exceeds the fracture gradient of the rock, creating or reopening networks of fractures extending hundreds of meters from the wellbore
- Sand grains prop open the fractures after pressure is released, creating permeable pathways
- Oil and gas flow through the fractures into the wellbore and to the surface
A typical shale well uses 15-20 million liters (4-5 million gallons) of water per fracking operation, with 15-80 stages of fracturing along a horizontal wellbore of 2,000-3,000 meters.
Key US Shale Plays
| Shale Play | State | Primary Product | Production (2023 approx.) |
|---|---|---|---|
| Permian Basin | Texas, New Mexico | Oil + gas | 6 mb/d oil |
| Eagle Ford | Texas | Oil + gas + condensate | 1.1 mb/d oil |
| Bakken | North Dakota, Montana | Oil | 1.1 mb/d oil |
| DJ Basin | Colorado | Oil + gas | 0.4 mb/d oil |
| Haynesville | Louisiana, Texas | Gas | 17 bcf/d gas |
| Marcellus/Utica | Pennsylvania, Ohio, WV | Gas | 35 bcf/d gas |
| Barnett | Texas | Gas | Declining |
The Permian Basin in West Texas and New Mexico has become the most productive oil basin in the world. Operators have continued improving efficiency through longer laterals, more fracturing stages, better completions design, and better reservoir understanding.
The Shale Revolution’s Impact
On US production: US oil production grew from 5 mb/d in 2008 to 12.9 mb/d in 2019, fell during COVID, and recovered to a record 13.3 mb/d by late 2023. The US surpassed Saudi Arabia and Russia as the world’s largest oil producer.
On global LNG: US shale gas production growth gave the US vast gas surpluses, enabling the development of major LNG export capacity and making the US the world’s largest LNG exporter.
On OPEC: The shale revolution fundamentally challenged OPEC’s pricing power by providing a large, flexible supply source outside OPEC control.
On natural gas prices: Henry Hub gas prices fell from $8-13/MMBtu in 2005-2008 to $2-4/MMBtu for most of the 2010s, transforming US manufacturing economics and enabling a coal-to-gas switch in power generation.
Environmental Controversies of Fracking
Hydraulic fracturing has been the subject of intense environmental debate:
- Water use: Large volumes required; water availability is a constraint in arid regions like the Permian
- Produced water disposal: High volumes of salty, chemical-laden water must be disposed of, typically by injection into disposal wells; this has been linked to induced seismicity in Oklahoma, Ohio, and other states
- Methane leakage: Shale operations have been found to leak methane more than conventional operations in some studies
- Surface footprint: Multiple well pads, roads, and pipelines affect land use
- Air quality: Volatile organic compound (VOC) emissions from shale operations affect local air quality
- Groundwater: Well-documented cases of water contamination near poorly cased wells, though industry argues proper casing eliminates risk
France, Germany, Scotland, Bulgaria, and several other countries have banned fracking. The UK briefly allowed it but imposed a moratorium in 2019 (lifted in 2022, then reinstated in 2022 by a new government). The US, Canada, Argentina, and China are the major commercial fracking producers.
22. Oil Sands and Heavy Oil
Conventional crude oil is not the only form of petroleum on Earth. Vast quantities of heavy, viscous hydrocarbons exist that require fundamentally different extraction techniques.
Oil Sands (Tar Sands)
Oil sands are a mixture of bitumen, sand, clay, and water. Bitumen is an extremely heavy, viscous form of petroleum (API gravity typically 8-12 degrees) that does not flow at surface temperatures. It must be either mined from the surface or heated in the ground to flow.
Canada’s Athabasca oil sands in northern Alberta are the world’s largest oil sands deposit, with approximately 170 billion barrels of proved reserves making Canada the world’s third-largest holder of proved reserves behind Venezuela and Saudi Arabia.
Surface mining: Used when oil sands are within about 75 meters of the surface. Giant bucket-wheel excavators and trucks strip and transport oil sand to a processing plant, where bitumen is separated from sand using hot water. This method disturbs vast areas of boreal forest and creates enormous tailings ponds. About 20% of Athabasca reserves are accessible by surface mining.
In-situ extraction (SAGD): Used for deeper deposits (75m+). Pairs of horizontal wells are drilled an upper injector well for steam, a lower producer well. Steam heats the bitumen, reducing its viscosity so it drains by gravity into the producer well. SAGD produces less surface disturbance but uses large amounts of water and energy.
After extraction, bitumen must be upgraded into synthetic crude oil (SCO) by removing carbon (coking) or adding hydrogen (hydrocracking) a process that adds cost and carbon intensity.
Carbon intensity of oil sands: Producing and upgrading a barrel of oil sands bitumen emits roughly 3-4 times more CO2 than producing a barrel of conventional crude. Overall well-to-wheel emissions are about 14-20% higher than average crude. Oil sands operators have been investing in reducing emissions through solvent-assisted processes, electrification, and experimental carbon capture.
Alberta’s oil sands production reached approximately 3.4 mb/d in 2023, making Canada the world’s fourth-largest oil producer.
Venezuelan Heavy Oil
Venezuela’s Orinoco Belt contains the world’s largest reserves of extra-heavy crude oil officially quoted by the Venezuelan government (PDVSA) at over 300 billion barrels. However, the economic reality has been starkly different. Venezuela’s oil production collapsed from over 3 mb/d in the late 1990s to below 0.8 mb/d by 2023 due to chronic underinvestment, mismanagement, US sanctions, and emigration of skilled workers.
23. Deepwater and Ultra-Deepwater Oil and Gas
As onshore and shallow-water resources in accessible areas declined, the industry pushed into ever-deeper water, driven by discoveries of massive hydrocarbon accumulations beneath the deep ocean floor.
Deepwater Definitions
- Deepwater: 300-1,500 meters water depth
- Ultra-deepwater: More than 1,500 meters water depth (commercial operations now reach 3,400+ meters)
Technical Challenges of Deepwater
Deepwater operations face extreme challenges:
- Pressure: At 3,000 meters depth, water pressure is approximately 300 bar enough to crush conventional equipment instantly
- Temperature: Deepwater temperatures are near freezing (2-4 degrees C), promoting gas hydrate formation in pipelines
- Remoteness: Everything must be performed remotely using Remotely Operated Vehicles (ROVs) there is no diver access below about 300 meters
- Logistics: Supply vessels must maintain position in potentially hostile open-ocean conditions
- Blowout risk: At depth, a blowout (uncontrolled well release) is extremely difficult to cap, as demonstrated by Deepwater Horizon in 2010
Major Deepwater Producing Regions
| Region | Key Fields | Peak Production |
|---|---|---|
| Gulf of Mexico (US) | Olympus, Atlantis, Mad Dog, Thunder Horse | ~1.9 mb/d |
| Brazil pre-salt | Tupi/Buzios, Sapinhoa, Lula | ~3.5 mb/d |
| West Africa | Jubilee (Ghana), Egina (Nigeria), CLOV (Angola) | ~2+ mb/d |
| North Sea | No ultra-deepwater; deepwater fields aging | Declining |
| Guyana | Stabroek Block (Exxon/Hess/CNOOC) | Growing rapidly |
| Mozambique | Coral FLNG, Rovuma area | Early production |
Brazil Pre-Salt: The Decade’s Biggest Discovery
Brazil’s pre-salt discoveries (2006-2010) beneath a thick layer of salt (up to 2,000 meters thick) in water depths of 2,000 meters are among the most significant oil finds in decades. The Buzios field alone is estimated to contain over 10 billion barrels of recoverable oil and was producing over 2 mb/d by 2023. Brazil’s national oil company Petrobras operates these fields with foreign partners.
Guyana: A New Oil Nation
ExxonMobil’s discovery of the Stabroek Block offshore Guyana in 2015 revealed an estimated 11 billion barrels of recoverable resources one of the largest deepwater discoveries in decades. Guyana, previously a minor oil producer, is now pumping over 600,000 b/d and is projected to reach 1.2 mb/d by 2027, transforming a small South American nation’s economy.
24. Arctic Oil and Gas
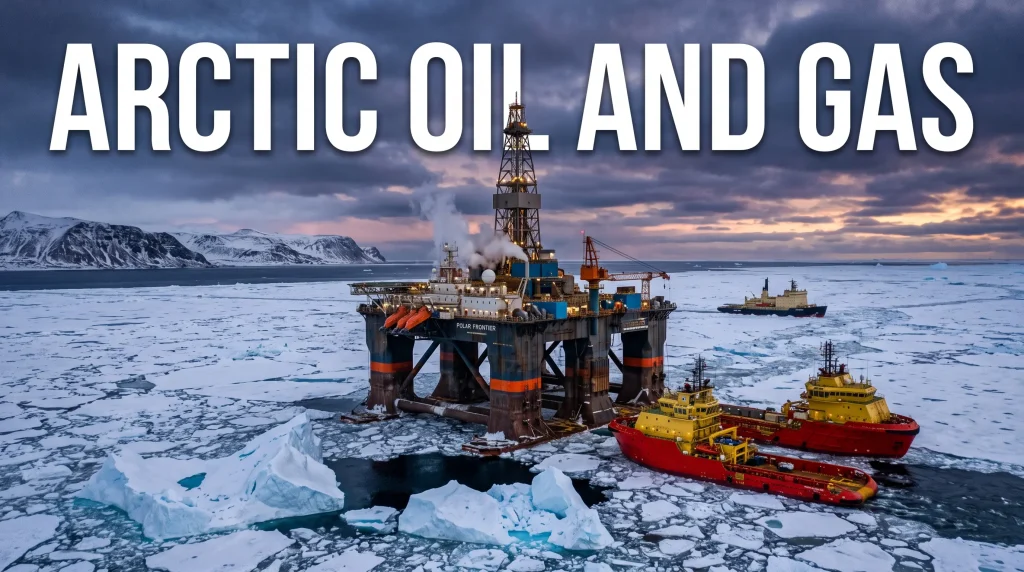
The Arctic region is estimated to contain approximately 13 percent of the world’s undiscovered conventional oil resources and 30 percent of undiscovered natural gas resources (USGS, 2008) largely concentrated in Russia’s Arctic continental shelf, Alaska, and Canada.
Major Arctic Oil and Gas Provinces
Russian Arctic: Russia is by far the most active Arctic producer. The Yamal Peninsula LNG project (producing 16.5 mt/y of LNG), the Vankor field in Siberia, and the Novoportovskoye field are among the most significant. Russia’s Rosneft and Gazprom have plans for vast Arctic shelf development, though Western sanctions following the 2022 Ukraine invasion halted international partnerships.
Alaska: The North Slope produces approximately 470,000 b/d from Prudhoe Bay and surrounding fields via the Trans-Alaska Pipeline System (TAPS). The Willow Project approved by the Biden administration in 2023 would add up to 180,000 b/d from the National Petroleum Reserve-Alaska (NPR-A) over its lifetime, at a cost of approximately $8 billion.
Norway: Norway’s Barents Sea developments, including the Johan Castberg field (production started 2024), extend Arctic offshore activity.
Environmental Sensitivity
The Arctic presents unique environmental challenges:
- Sea ice complicates drilling and shipping operations
- Extremely remote locations limit emergency response capability
- An oil spill in Arctic conditions would be far harder to contain and clean up than in temperate waters (cold temperatures impede oil weathering and biodegradation)
- Arctic ecosystems are highly sensitive and support indigenous communities dependent on marine and terrestrial wildlife
- Permafrost thaw from climate change is paradoxically both opening new areas for exploration and threatening onshore pipeline and facility infrastructure
International Arctic governance is complex, involving the Arctic Council (Canada, Denmark, Finland, Iceland, Norway, Russia, Sweden, USA), the UN Convention on the Law of the Sea (UNCLOS), and bilateral agreements.
25. Petrochemicals: Oil and Gas Beyond Fuel
Approximately 12-15 percent of global oil and about 8 percent of global gas go not to energy but to petrochemical production the manufacturing of chemicals, plastics, synthetic fibers, fertilizers, medicines, and countless other materials. As energy demand potentially peaks, petrochemicals are projected to become the dominant driver of oil demand growth.
From Crude to Chemicals: The Naphtha Route
The main petrochemical feedstock from oil refining is naphtha (a light distillate fraction). Naphtha is fed into a steam cracker a furnace that reaches 850 degrees C which breaks (cracks) the naphtha molecules into olefins:
- Ethylene (C2H4): The world’s most produced organic chemical. About 200 million tonnes per year globally. Feedstock for polyethylene (PE), polyvinyl chloride (PVC), polystyrene, ethylene glycol (antifreeze, PET plastic).
- Propylene (C3H6): Second most important. Used to make polypropylene (PP), acrylics, nylon.
- Butadiene: Synthetic rubber for tires.
- Benzene, toluene, xylene (BTX aromatics): From catalytic reforming. Feedstocks for PET, polystyrene, polyurethanes, pharmaceuticals.
From Natural Gas to Chemicals: The Ethane Route
Natural gas is a direct petrochemical feedstock. The ethane extracted from natural gas is an excellent and cheaper steam cracker feed (compared to naphtha). The US shale gas revolution dramatically reduced ethane costs and triggered a wave of US ethane cracker investments in the 2010s-2020s, shifting the competitive balance in global petrochemicals.
Fertilizers: Oil and Gas Feeding the World
Natural gas is the feedstock for ammonia production via the Haber-Bosch process:
N2 + 3H2 -> 2NH3 (using methane-derived hydrogen)
Ammonia is the precursor to virtually all nitrogen fertilizers (urea, ammonium nitrate, ammonium sulfate). About 1.8 billion people’s food security depends on nitrogen fertilizers produced from natural gas. The 2022 European gas price crisis forced ammonia plants to shut down as gas prices became uneconomical, directly impacting global fertilizer availability and driving food price inflation.
Global ammonia production is approximately 185 million tonnes per year, consuming about 2 percent of global energy.
Plastics and the Sustainability Challenge
Oil and gas-derived plastics have transformed modern life enabling lightweight vehicles, food preservation, medical devices, electronics insulation, construction materials, and countless other applications. Global plastics production reached approximately 400 million tonnes in 2022.
However, plastics present a profound sustainability challenge:
- Approximately 8 million tonnes of plastic enter the ocean each year
- Only 9 percent of all plastic ever produced has been recycled (as of the 2023 UNEP estimate)
- Microplastics have been found in human blood, lung tissue, and placenta
- Single-use plastic bans are proliferating globally
- Chemical recycling (pyrolysis, gasification) is emerging as a potential solution but remains small-scale
The petrochemical industry argues that plastics have net climate benefits (lighter vehicles, food waste reduction, building insulation) that are not captured in simple lifecycle assessments.
26. Environmental Impact of Oil and Gas
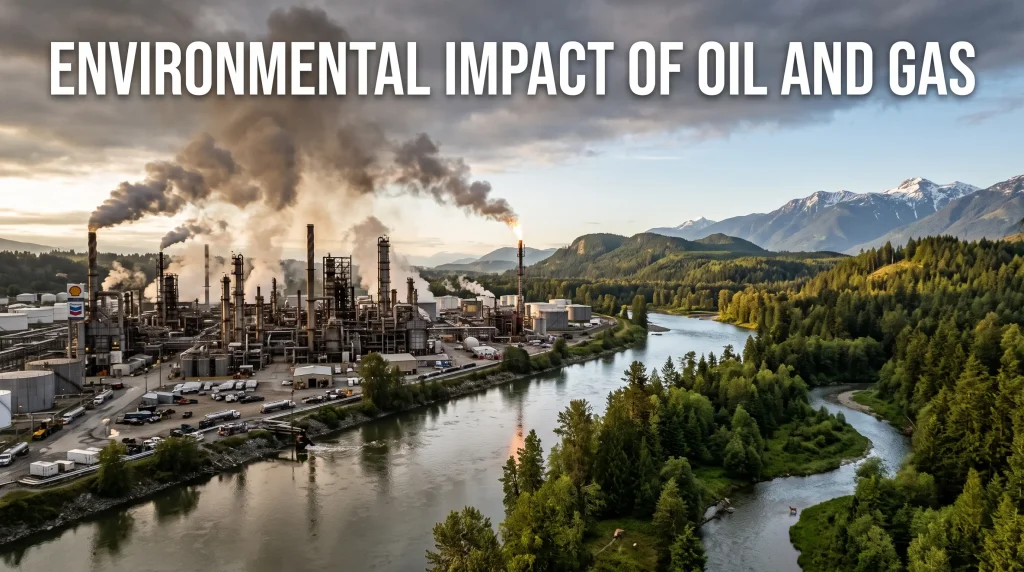
The environmental impact of the oil and gas industry spans from local ecosystem damage during production to global climate change from the combustion of fossil fuels.
Climate Change: The Central Challenge
The burning of oil and gas is the world’s largest source of CO2 emissions. According to the IEA World Energy Outlook 2023:
- Global energy-related CO2 emissions in 2022: 36.8 billion tonnes (a record)
- Oil combustion accounts for approximately 11 billion tonnes (30%)
- Natural gas combustion: approximately 7 billion tonnes (19%)
- Coal combustion: approximately 15 billion tonnes (41%)
To limit warming to 1.5 degrees C (the Paris Agreement target), the IEA’s Net Zero by 2050 scenario calls for no new oil and gas field approvals beyond those already committed as of 2021. Despite this, new field approvals continued globally through 2022-2024.
Air Pollution
Beyond CO2, oil and gas production and combustion emit:
- Sulfur dioxide (SO2): From refining high-sulfur crude and burning marine fuel oil. Causes acid rain and respiratory disease.
- Nitrogen oxides (NOx): From combustion in engines, turbines, and furnaces. Ozone precursor.
- Volatile Organic Compounds (VOCs): From production sites, storage tanks, and vehicle exhaust. Precursors to ground-level ozone and carcinogens.
- Particulate matter (PM2.5, PM10): From diesel combustion and flaring. Major respiratory health hazard.
- Black carbon (soot): Short-lived climate forcer with 460-1,500 times the warming potential of CO2 over a 20-year period.
Air pollution from fossil fuel combustion is estimated to cause 3.6 million premature deaths per year globally (Health Effects Institute, 2023), making it one of the leading environmental health threats.
Land and Water Contamination
- Produced water: Large volumes of highly saline, chemically complex water produced with oil and gas must be managed. Spills or improper disposal contaminate surface water and groundwater.
- Drilling waste: Cuttings, mud, and chemicals from drilling operations must be treated and disposed of properly.
- Pipeline corrosion and leaks: Aging pipelines contaminate soils and water bodies.
- Refinery pollution: Refineries discharge process water (carefully treated) and generate solid wastes (spent catalysts, tank sludge) requiring proper management.
Biodiversity and Habitat
- Seismic surveys have been documented to harm marine mammals (whales, dolphins) through acoustic injury.
- Offshore drilling creates noise, light, and chemical pollution that affects marine ecosystems.
- Pipeline construction through wilderness areas and rainforests (such as ENBRIDGE’s Line 3 in Minnesota or projects in the Amazon) displaces wildlife and fragments habitat.
- Oil sands mining in Alberta’s boreal forest has disturbed over 1 million hectares of ecologically sensitive land.
27. Oil Spills: Causes, Effects, and Response
Oil spills are among the most dramatic and visible environmental consequences of the oil and gas industry. While the frequency of large tanker spills has decreased dramatically over the past 50 years due to double-hull requirements and improved operations, spills continue to occur from pipelines, onshore facilities, and offshore operations.
Major Historical Oil Spills
| Incident | Year | Volume Spilled | Cause |
|---|---|---|---|
| Deepwater Horizon (Gulf of Mexico) | 2010 | 4.9 million barrels | Well blowout |
| Ixtoc I (Gulf of Mexico) | 1979 | 3.3 million barrels | Well blowout |
| Atlantic Empress (Caribbean) | 1979 | 2.1 million barrels | Tanker collision |
| Exxon Valdez (Alaska) | 1989 | 257,000 barrels | Tanker grounding |
| Prestige (Spain) | 2002 | 630,000 barrels | Tanker sinking |
| MV Wakashio (Mauritius) | 2020 | 1,000 tonnes | Tanker grounding |
| Niger Delta (ongoing) | 1970s-present | 9-13 million barrels total | Multiple causes |
The Deepwater Horizon disaster (April-September 2010) is the largest accidental marine oil spill in history. The Macondo well blowout in the Gulf of Mexico killed 11 workers, injured 17, and discharged approximately 4.9 million barrels of oil over 87 days before the well was capped. BP paid over $65 billion in cleanup costs, fines, and legal settlements. The disaster led to sweeping regulatory reforms of offshore safety in the US and globally.
Environmental Effects of Oil Spills
- Immediate effects: Acute toxicity to fish, birds (oiled feathers), marine mammals (skin, ingestion), and invertebrates. Coating of shorelines and marshes. Deoxygenation of water column.
- Chronic effects: Bioaccumulation of polycyclic aromatic hydrocarbons (PAHs) through food chains. Long-term reproductive impairment in fish and birds. Marsh grass die-off. Alteration of sediment microbial communities.
- Exxon Valdez legacy: Over 30 years after the 1989 Exxon Valdez spill in Prince William Sound, Alaska, oil persists in sediments. Herring populations have never fully recovered. Some orca pods affected by the spill have declined to near-extinction levels.
Oil Spill Response
Modern oil spill response uses several techniques:
Containment booms: Floating barriers to contain surface oil slicks and protect sensitive shorelines.
Mechanical skimmers: Vessels equipped with devices that remove oil from the water surface.
Chemical dispersants: Chemicals (such as Corexit) that break oil into smaller droplets, allowing it to mix into the water column and be biodegraded more rapidly. Controversial because of the toxicity of both the dispersant and the dispersed oil droplets to marine organisms.
In-situ burning: Oil corralled by booms is ignited and burned. Effective in certain conditions.
Bioremediation: Application of fertilizers to stimulate natural hydrocarbon-degrading bacteria. Used on beaches after Exxon Valdez.
Natural attenuation: In warm waters with active microbial communities, oil weathers and biodegrades naturally over time.
28. Methane Emissions and Leak Detection
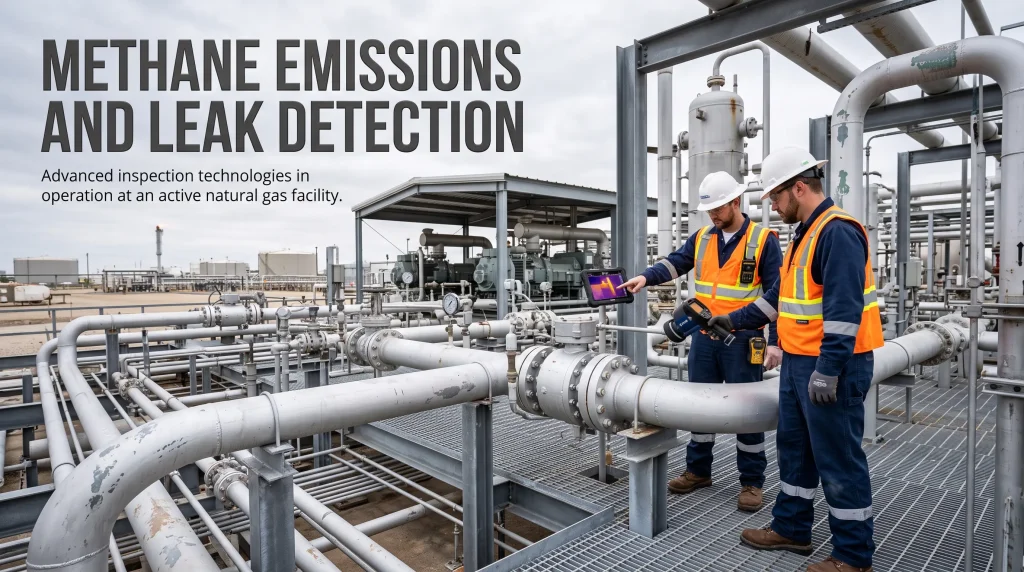
Methane (CH4) is a potent greenhouse gas with a global warming potential (GWP) approximately 84 times that of CO2 over a 20-year period and 28-36 times over 100 years (IPCC AR6). The oil and gas industry is one of the largest anthropogenic sources of methane.
Sources of Methane in Oil and Gas Operations
- Venting: Intentional release of gas (for operational or safety reasons) from wellheads, storage tanks, pipelines, and processing facilities
- Flaring: Incomplete combustion of flared gas releases unburned methane
- Fugitive emissions: Unintentional leaks from valves, flanges, compressor seals, and meters
- Pneumatic devices: Devices powered by high-pressure gas that vent to atmosphere
- Abandoned wells: Improperly plugged old wells can leak methane for decades
The IEA estimated global methane emissions from the oil and gas sector at approximately 120-130 million tonnes per year (2022) enough to cause as much near-term warming as all CO2 from the US coal sector.
The Importance of Getting Methane Right
Studies (particularly satellite-based measurements by GHGSat, MethaneSAT, and Sentinel-5P) have revealed that actual methane emissions from oil and gas operations are significantly higher than industry-reported figures in many regions. A 2022 study in Science found that US oil and gas methane emissions were 70 percent higher than EPA inventory estimates.
This matters enormously for the climate calculus of natural gas as a “bridge fuel.” If methane leakage rates exceed approximately 3 percent, natural gas-fired power generation offers no climate benefit over coal over a 20-year timeframe.
Leak Detection and Repair (LDAR)
The industry and regulators have increasingly focused on LDAR programs:
- Ground-level inspection: Optical gas imaging (OGI) cameras detect gas leaks through infrared imaging. Technicians walk equipment with handheld cameras.
- Continuous monitoring: Fixed methane sensors at facilities provide real-time leak alerts.
- Aerial surveys: Aircraft and drones equipped with methane detectors can survey large areas quickly.
- Satellite monitoring: GHGSat’s commercial satellites can detect large point-source emitters globally. MethaneSAT (Environmental Defense Fund) launched in 2024 to monitor global oil and gas basins.
The US EPA’s 2024 final methane rule requires oil and gas operators to monitor and repair leaks comprehensively one of the strongest federal methane regulations ever issued.
Global Methane Pledge
At COP26 (Glasgow, November 2021), more than 150 countries signed the Global Methane Pledge, committing to reduce global methane emissions by at least 30 percent by 2030 from 2020 levels. Oil and gas is the most tractable sector for near-term methane reductions since many leaks can be fixed cost-effectively or even profitably (by capturing gas that was previously wasted).
29. Carbon Capture in Oil and Gas Operations
Carbon Capture, Utilization, and Storage (CCUS) involves capturing CO2 emissions from industrial processes and either storing them permanently underground or using them industrially. The oil and gas industry has both the most CCUS experience and the most need for it.
History of CCS in Oil and Gas
The world’s first large-scale CCS project was the Sleipner project in the Norwegian North Sea, operational since 1996. CO2 from Equinor’s Sleipner gas field (where the produced gas contained 9% CO2, above pipeline specification) is captured and injected into a saline aquifer beneath the North Sea. Approximately 1 million tonnes of CO2 per year are stored. Over 25 years of monitoring have confirmed the CO2 remains stable underground.
Major early CCS projects:
- Weyburn-Midale (Canada): CO2 injected for EOR in Saskatchewan. 30+ million tonnes stored since 2000.
- In Salah (Algeria): BP, Equinor, Sonatrach project stored 3.8 million tonnes before being suspended in 2011.
- Gorgon (Australia): Chevron’s LNG project committed to inject CO2 from gas processing. Suffered technical problems and achieved only 30 percent of its target injection rate through 2021.
- Quest (Canada): Shell’s oil sands CCS project has stored over 8 million tonnes of CO2 since 2015.
Current Scale and Future Plans
Global operational CCUS capacity in 2023 was approximately 45 million tonnes per year a tiny fraction of the billions of tonnes per year that would be needed for net-zero scenarios (IEA Net Zero scenario requires 7.6 billion tonnes per year of CCS by 2050).
Major CCS development hubs include:
- US Gulf Coast: Multiple projects leveraging tax credits (Section 45Q $85/tonne for geologic storage, expanded by the Inflation Reduction Act 2022)
- North Sea: Norwegian full-chain CCS (Northern Lights project), UK East Coast Cluster
- Middle East: Saudi Aramco’s Uthmaniyah project
- China: Multiple industrial CCS projects in development
CO2-EOR
A specific form of CCUS involves using captured CO2 for Enhanced Oil Recovery (CO2-EOR), injecting it into aging oil fields to increase production while storing CO2. CO2-EOR has operated commercially in the US Permian Basin since the 1970s, using natural CO2 from geological deposits. Switching to anthropogenic (captured industrial) CO2 converts CO2-EOR from a carbon-intensive to a potentially carbon-neutral activity.
30. Oil and Gas Regulations and Compliance
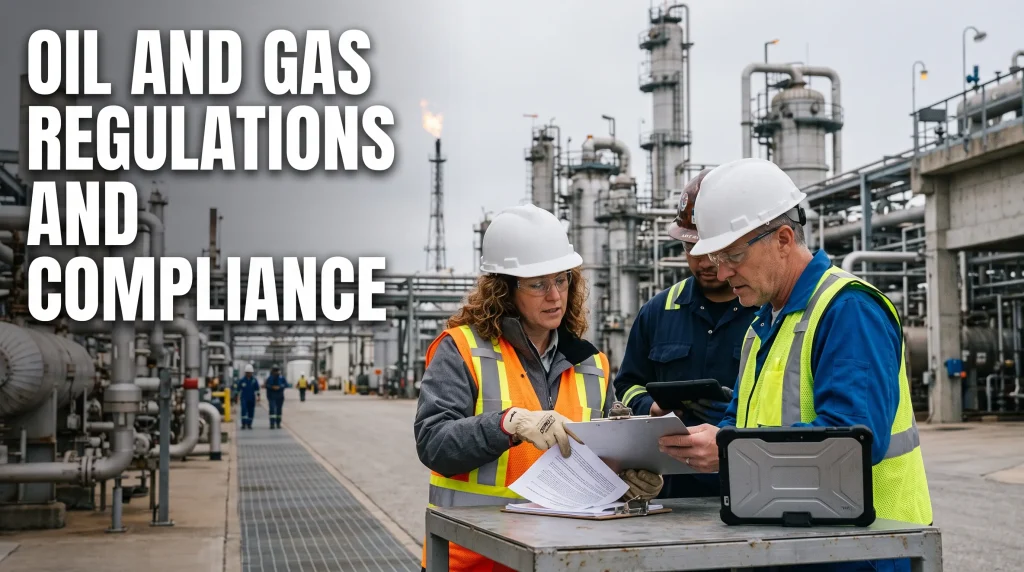
The oil and gas industry is one of the most heavily regulated sectors globally, for good reason its operations can have catastrophic consequences for workers, communities, and the environment if not properly managed.
Regulatory Framework
Oil and gas regulation operates at multiple levels:
National/Federal regulations:
- Licensing and concession awards (who can explore and produce)
- Technical standards for drilling and production safety
- Environmental impact assessment requirements
- Pipeline safety regulations
- Product quality standards (fuel specifications)
- Taxation and fiscal terms
Regional/State regulations:
- Land use and surface access
- Water management (especially for hydraulic fracturing)
- Air emission standards
- Setback distances from residences and sensitive areas
International standards and frameworks:
- UNCLOS (United Nations Convention on the Law of the Sea): Defines jurisdiction over offshore resources
- Paris Agreement: National commitments to reduce emissions
- MARPOL: International Convention for the Prevention of Pollution from Ships regulates tanker discharges, bunker fuel sulfur content
- IMO 2020: Reduced maximum sulfur content in marine fuels from 3.5% to 0.5% globally, effective January 2020
Key US Regulations
| Regulation | Agency | Scope |
|---|---|---|
| NEPA (National Environmental Policy Act) | EPA / BOEM | Environmental review of federal permits |
| Clean Water Act | EPA | Discharge of pollutants to waters |
| Clean Air Act | EPA | Air emissions from facilities |
| Outer Continental Shelf Lands Act | BOEM | Offshore leasing and safety |
| Pipeline Safety Act | PHMSA | Pipeline integrity and safety |
| EPA Methane Rule (2024) | EPA | Methane LDAR requirements |
European Regulations
The EU has implemented increasingly stringent oil and gas regulations:
- EU Methane Regulation (2024): Mandatory LDAR monitoring, limits on venting and flaring for all EU and imported oil and gas
- EU ETS (Emissions Trading System): Refineries and gas-fired power plants pay for CO2 emissions
- CBAM (Carbon Border Adjustment Mechanism): From 2026, importers of carbon-intensive goods (including potentially oil products) will pay a carbon price equivalent to EU ETS
Licensing and Fiscal Terms
Governments control access to their oil and gas resources through various contractual arrangements:
| Contract Type | Description | Examples |
|---|---|---|
| Concession/license | Company owns produced oil and pays royalties and taxes | US, UK, Norway, Australia |
| Production Sharing Contract (PSC) | Oil split between government and company after cost recovery | Angola, Indonesia, Libya, Ghana |
| Service contract | Company provides services for a fee; government owns all production | Iraq, Kuwait, Mexico (some) |
| Joint venture | Government NOC holds a carried or paying interest | Many African countries |
Fiscal terms vary enormously from Norway’s very high government take (78% petroleum tax plus company tax) justified by its highly profitable province to frontier countries offering generous terms to attract investment.
31. Health and Safety in Oil and Gas
The oil and gas industry is one of the most hazardous industries in the world, with unique risks from high pressures, flammable and toxic substances, remote locations, and extreme environments. Industry-wide safety management has improved dramatically over recent decades but significant incidents still occur.
Major Hazards
Process safety hazards (catastrophic risk):
- Blowout: Uncontrolled release of oil and gas from a well. Causes: failure of well barriers, pressure underestimation, BOP failure. Can result in fire, explosion, injury, death, and massive environmental damage. Deepwater Horizon (2010) and Piper Alpha (1988) are the most notorious examples.
- Fire and explosion: Hydrocarbon leaks can ignite catastrophically on platforms, in refineries, and at gas processing plants. Piper Alpha (1988, North Sea) killed 167 of the 229 people on the platform.
- Toxic gas release: H2S (hydrogen sulfide) is a highly toxic gas present in sour oil and gas. IDLH (Immediately Dangerous to Life or Health) concentration is 100 ppm; high concentrations can cause instant incapacitation and death. H2S safety is a critical element of all sour field operations.
Occupational safety hazards:
- Struck by / caught in rotating equipment
- Falls from height
- Vehicle and lifting incidents
- Noise-induced hearing loss
- Fatigue (offshore rotations can be 14-day on, 14-day off)
- Ergonomic injuries
Key Safety Metrics
The industry uses several standard safety metrics:
| Metric | Definition |
|---|---|
| TRIR (Total Recordable Incident Rate) | Recordable injuries per 200,000 man-hours |
| LTIR (Lost Time Incident Rate) | Incidents causing lost work time per 200,000 man-hours |
| Fatality rate | Fatalities per 100,000 workers per year |
| Process Safety Events (PSE) | Tier 1 (major) and Tier 2 (significant) unplanned releases |
The global oil and gas industry average TRIR has declined from over 3.0 in the 1990s to under 1.0 in many regions today. However, performance varies enormously between operators and regions.
Key Safety Systems and Regulations
Safety Case Regime (UK, Australia, Norway): Operators must demonstrate to regulators that major accident risks are as low as reasonably practicable (ALARP). The safety case regime was introduced in the UK following the Cullen Inquiry into the Piper Alpha disaster.
SEMS (Safety and Environmental Management System, US): Required by BSEE (Bureau of Safety and Environmental Enforcement) for all OCS operators following Deepwater Horizon.
Process Safety Management (PSM, US): OSHA’s PSM standard (29 CFR 1910.119) applies to onshore facilities with covered chemicals above threshold quantities.
Lock-Out Tag-Out (LOTO): Energy isolation procedures to prevent accidental energization of equipment during maintenance.
Permit to Work (PTW): Formal documented system for authorizing hazardous work.
Emergency Response and Well Control: Specialized contractors (WELL CONTROL, Boots and Coots, Wild Well Control) stand ready globally to respond to well blowouts. Post-Deepwater Horizon, the industry established MWCC (Marine Well Containment Company) in the Gulf of Mexico and similar organizations elsewhere to provide containment systems for deepwater blowouts.
32. Oil and Gas Companies: IOCs, NOCs, and Independents
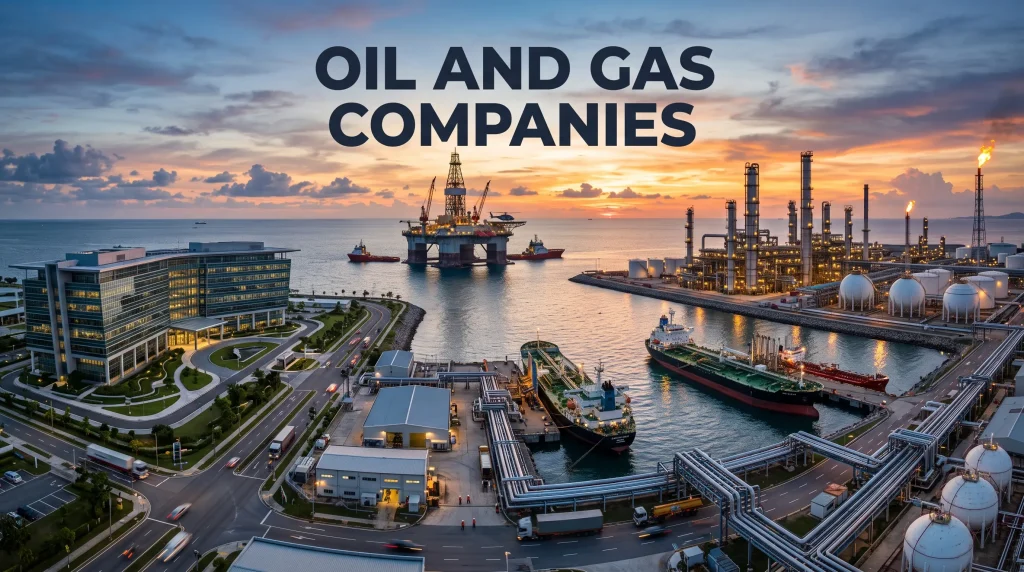
The global oil and gas industry is dominated by a mix of international oil companies (IOCs), national oil companies (NOCs), and independent producers.
International Oil Companies (IOCs)
IOCs are publicly listed, shareholder-owned companies that operate globally:
| Company | Headquarters | 2023 Revenue (approx.) | Production (approx.) |
|---|---|---|---|
| ExxonMobil | USA | $400 billion | 3.7 mb/d oil equivalent |
| Shell | UK / Netherlands | $380 billion | 2.9 mb/d oil equivalent |
| BP | UK | $290 billion | 2.3 mb/d oil equivalent |
| Chevron | USA | $235 billion | 3.1 mb/d oil equivalent |
| TotalEnergies | France | $230 billion | 2.5 mb/d oil equivalent |
| ConocoPhillips | USA | $58 billion | 1.8 mb/d oil equivalent |
| Equinor | Norway (51% state) | $122 billion | 2.1 mb/d oil equivalent |
IOCs face growing pressure from shareholders, governments, and civil society to reduce emissions, set net-zero targets, and invest in clean energy. Their strategies vary considerably TotalEnergies and Equinor have made larger renewables investments; ExxonMobil and Chevron have focused on shareholder returns and maintained core oil and gas focus.
National Oil Companies (NOCs)
NOCs are state-owned companies that control the majority of global reserves:
| NOC | Country | Proven Reserves (billion bbl) | Production (mb/d) |
|---|---|---|---|
| Saudi Aramco | Saudi Arabia | 268 | 12 |
| NIOC | Iran | 210 | 3.8 |
| Iraq NOC | Iraq | 145 | 4.5 |
| ADNOC | UAE | 111 | 4.0 |
| Kuwait Petroleum | Kuwait | 102 | 2.7 |
| Pemex | Mexico | 8.4 | 1.9 |
| PDVSA | Venezuela | 303 (disputed) | 0.8 |
| CNOOC / CNPC / Sinopec | China | 25 | 4.2 (combined) |
| Petrobras | Brazil (state majority) | 13 | 2.9 |
| Gazprom / Rosneft | Russia | 80 | 10.8 (combined) |
Saudi Aramco the Saudi Arabian Oil Company is by most measures the world’s most valuable and most profitable company. It reported net income of $161 billion in 2022 and $121 billion in 2023. The Saudi government owns approximately 98 percent of Aramco (a small stake was floated on the Riyadh stock exchange in 2019).
Independent Oil and Gas Companies
Independents focus on exploration and production without downstream (refining, retail) operations. They range from large US-listed companies to small private operators:
- Large independents: Pioneer Natural Resources, Devon Energy, EOG Resources, Diamondback Energy, Coterra Energy, APA Corporation
- Mid-size: Callon Petroleum, Matador Resources, Ovintiv
- Small/private: Thousands of operators in the US alone
The US shale revolution was pioneered significantly by independents smaller, more entrepreneurial companies willing to take technical risks that the majors avoided.
33. Oil and Gas Finance and Investment
The oil and gas industry is capital-intensive, cyclical, and increasingly subject to ESG (Environmental, Social, and Governance) pressure. Understanding how the industry is financed and valued is essential context.
Capital Expenditure Cycles
Oil and gas investment is highly cyclical, driven by oil price expectations. When prices are high, companies invest heavily in new capacity; when prices are low, they cut investment. This creates a boom-bust cycle:
- 2014 peak upstream capex: ~$900 billion globally
- 2016 trough: ~$450 billion
- 2019: ~$580 billion
- 2020 (COVID): ~$350 billion (lowest since 2006)
- 2022: ~$680 billion
- 2024 forecast: ~$700-720 billion
Under-investment during 2015-2020 contributed to the supply tightness and price increases of 2021-2022.
Oil and Gas Valuation Methods
Reserve-based metrics:
- NAV (Net Asset Value): Discounted cash flow value of proved and probable reserves
- EV/2P: Enterprise value divided by proved and probable reserves
Production-based metrics:
- EV/EBITDA: Enterprise value / earnings before interest, tax, depreciation, and amortization
- P/CF: Price-to-cash flow per share
Sector-specific:
- Breakeven oil price: The oil price at which a company or project generates positive free cash flow
- Finding and Development cost (F&D): Cost to find and develop a barrel of reserves ($/bbl)
- Reserve Replacement Ratio (RRR): New reserves added as percentage of production
ESG and the Energy Transition Investment Dilemma
The major oil companies face a profound capital allocation challenge:
- Maintaining oil and gas investment is needed to meet current demand and generate returns
- But new oil and gas projects committed now will produce for 20-30 years into a world that may have significantly lower fossil fuel demand
- Investment in renewables and clean energy offers lower returns (typically 6-10% vs 15-20% for shale in good times) but is politically and socially demanded
Major institutional investors (BlackRock, Vanguard, State Street), pension funds, and sovereign wealth funds have faced growing pressure from activists and clients to divest from fossil fuels or engage to accelerate transition. The resulting ESG-driven divestment from oil and gas has made capital more expensive for some producers.
Simultaneously, the energy security concerns triggered by the Russia-Ukraine war led to pushback against rapid divestment, as countries needed to secure affordable energy supplies.
Oil as a Financial Instrument
Oil futures and options are among the most actively traded commodity derivatives globally:
- NYMEX WTI futures: Over 1 million contracts per day
- ICE Brent futures: Over 1.2 million contracts per day
- Options markets: Used by producers to hedge price risk, airlines to hedge jet fuel cost
Producers often hedge a portion of their future production using futures contracts to protect cash flow. Airlines hedge jet fuel purchases. Refiners hedge crack spreads (the margin between crude and refined product prices).
34. Energy Transition and the Future of Oil and Gas
No topic is more contested or consequential for the oil and gas industry than the energy transition the global shift from fossil fuels to low-carbon energy sources.
Competing Demand Scenarios
Major energy agencies publish annual scenarios with widely divergent outlooks for oil and gas demand:
| Scenario | Organization | Oil Demand 2030 | Oil Demand 2040 | Peak Oil Demand |
|---|---|---|---|---|
| Net Zero by 2050 (NZE) | IEA | 77 mb/d | 43 mb/d | 2023 (already peaked) |
| Announced Pledges (APS) | IEA | 93 mb/d | 80 mb/d | late 2020s |
| Stated Policies (STEPS) | IEA | 97 mb/d | 95 mb/d | No peak before 2030 |
| Reference Case | EIA (US) | 101 mb/d | 105 mb/d | Post-2035 |
| Reference Case | OPEC (2023 WOO) | 106 mb/d | 109 mb/d | Post-2045 |
The gap between the IEA’s NZE scenario and OPEC’s reference case is enormous representing trillions of dollars of investment decisions and the fate of producer nation economies.
Electrification and EVs: Challenging Gasoline Demand
The most immediate and quantifiable threat to oil demand is the rise of electric vehicles:
- Global EV sales in 2023: 14 million units (approximately 18% of new car sales globally)
- China accounted for 60 percent of global EV sales in 2023
- IEA forecasts EVs to displace approximately 5 mb/d of oil demand by 2030 in its announced pledges scenario
However, oil demand for trucks, aviation, shipping, and petrochemicals is harder to displace. Many analysts believe global oil demand will plateau at 95-105 mb/d in the late 2020s or 2030s rather than decline sharply.
Natural Gas as a Transition Fuel
Natural gas occupies a peculiar position in the energy transition:
- It emits about half the CO2 of coal per unit of electricity generated driving coal-to-gas switching in power generation
- It is politically supported as a “transition fuel” by many governments
- But new gas infrastructure locks in demand for 30-40 years
- Methane leakage undermines the climate benefit of gas vs coal in power generation
- Renewable energy costs have fallen so sharply that many economists question whether gas is truly a “bridge” or a detour
The global LNG trade boom suggests gas demand will remain substantial through at least the 2030s in Asia, even as European gas demand falls.
The Stranded Asset Risk
If global policy and technology deployment accelerate decarbonization faster than current scenarios suggest, a significant portion of oil and gas reserves could become “stranded assets” reserves that cannot be produced before the world stops needing them or before a carbon price makes them uneconomical.
A 2015 study in Nature (McGlade and Ekins) estimated that one-third of oil reserves, half of gas reserves, and over 80 percent of coal reserves would need to remain in the ground for a 2-degree C pathway.
The stranded asset risk is not uniform:
- High cost, high carbon producers (Canadian oil sands, Venezuelan heavy oil, Arctic projects) face the greatest risk
- Low cost, low carbon conventional producers (Saudi Arabia, UAE, Kuwait) may be the last producers standing in a low-demand world
- This dynamic encourages low-cost producers to pump more now, increasing near-term supply and paradoxically depressing prices
IOC Strategies for the Energy Transition
| Company | Primary Strategy |
|---|---|
| ExxonMobil | Focus on core oil and gas; invest in CCUS and low-carbon hydrogen |
| Chevron | Focus on oil and gas efficiency; some CCUS; renewable fuels |
| Shell | Diversifying into LNG, renewables, EV charging (Shell Recharge), hydrogen |
| BP | Most aggressive diversification; set target of 50 GW renewables by 2030; pulled back somewhat in 2023 |
| TotalEnergies | Significant renewables investment alongside core oil and gas |
| Equinor | Strong offshore wind investment; North Sea carbon storage |
The right balance between maintaining profitable oil and gas production and investing in transition businesses remains one of the most contested strategic debates in the corporate world.
35. Careers in Oil and Gas
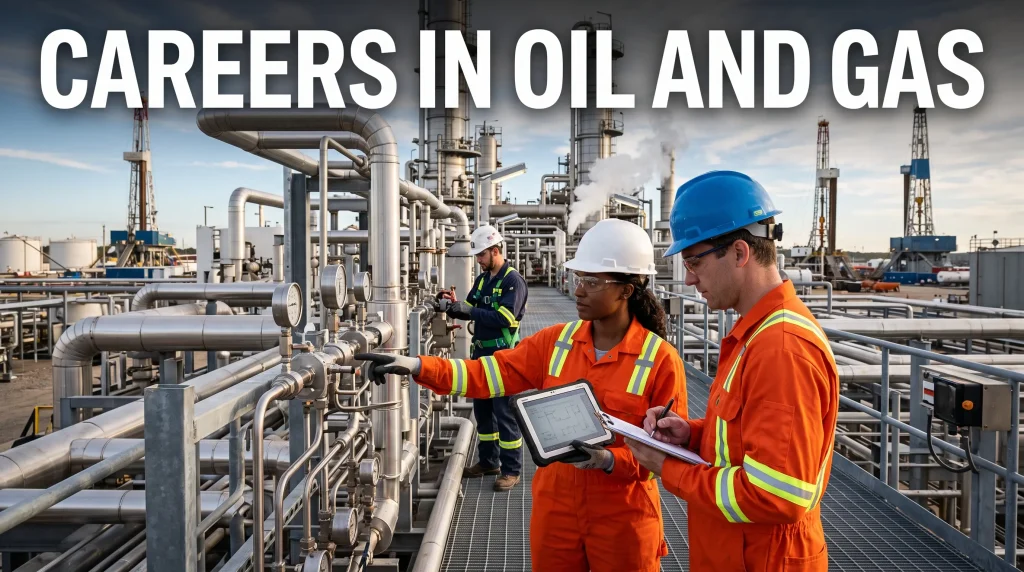
Despite energy transition uncertainty, the oil and gas industry remains a major employer globally and offers well-paying careers across a wide range of disciplines. The industry also faces a talent challenge: an aging workforce nearing retirement, and difficulty attracting younger workers concerned about the sector’s long-term prospects.
Core Technical Disciplines
| Role | Description | Typical Qualification |
|---|---|---|
| Petroleum engineer | Well design, reservoir management, production optimization | BSc Petroleum or Chemical Engineering |
| Geologist / Geophysicist | Reservoir characterization, seismic interpretation, exploration | BSc/MSc Geology or Geophysics |
| Reservoir engineer | Simulation modeling, reserves estimation, field development planning | BSc Engineering + postgraduate |
| Drilling engineer | Well planning, rig operations, wellbore integrity | BSc Mechanical or Petroleum Engineering |
| Process / Chemical engineer | Refining, gas processing, facilities design | BSc Chemical Engineering |
| Pipeline engineer | Integrity, design, hydraulics | BSc Civil or Mechanical Engineering |
| HSE (Health, Safety, Environment) | Safety management, risk assessment, regulatory compliance | Engineering or science + safety qualifications |
| Subsea engineer | Subsea equipment design and operations | BSc Mechanical or Subsea Engineering |
Business and Commercial Roles
- Commercial / Trading: Oil and gas trading, LNG commercialization, hedging
- Finance: Project finance, valuations, M&A in energy sector
- Legal: Upstream and downstream contracts, regulatory compliance, arbitration
- Project management: Large-scale capital project delivery
- IT / Digital: Subsurface data management, digital twin development, AI in operations
Salaries
| Role | Early Career (US, approx.) | Mid-Career (US, approx.) |
|---|---|---|
| Petroleum engineer | $90,000-$120,000 | $150,000-$250,000+ |
| Geologist / Geophysicist | $80,000-$110,000 | $130,000-$200,000 |
| Process engineer | $75,000-$100,000 | $120,000-$180,000 |
| Drilling engineer | $85,000-$115,000 | $140,000-$220,000 |
| HSE professional | $60,000-$90,000 | $100,000-$160,000 |
| Offshore technician | $60,000-$80,000 + offshore premium | $90,000-$130,000 |
Offshore roles typically include an “offshore premium” in the form of higher base pay or allowances to compensate for the demanding rotational lifestyle (typically 2-4 weeks offshore followed by equal time onshore).
The Evolving Skill Set
As the industry digitizes and decarbonizes, new skills are increasingly valued:
- Data science and machine learning: Subsurface prediction, production optimization, predictive maintenance
- Carbon accounting: Measuring and reducing Scope 1, 2, and 3 emissions
- CCUS expertise: Carbon capture engineering and project development
- Hydrogen: Production, transport, and storage of low-carbon hydrogen
- ESG reporting: Sustainability reporting, TCFD compliance
The energy transition is creating new adjacent career paths in offshore wind (which uses many similar skills and equipment to offshore oil and gas), CCUS, and hydrogen giving oil and gas professionals a route to “transition” their own careers.
36. Frequently Asked Questions
Q: What is the difference between oil and natural gas?
Oil (crude oil) is a liquid hydrocarbon mixture found underground, while natural gas is primarily methane in gaseous form. They often form together and are produced together, but require different processing, transport, and end-use technologies.
Q: Where is most of the world’s oil located?
The Middle East holds the largest share of proved oil reserves approximately 48 percent of the global total. Saudi Arabia, Iraq, Iran, UAE, and Kuwait together hold about 60 percent of global proved reserves.
Q: How long will oil and gas last?
At current production rates, proved reserves represent about 47 years of oil supply and 50 years of gas supply. However, this “R/P ratio” is misleading it is not a countdown to exhaustion. New reserves are discovered and technically recoverable resources increase with technology. The real question is not physical scarcity but whether the world will choose to stop using oil and gas before reserves are exhausted.
Q: What is peak oil?
Peak oil originally referred to the point at which global oil production reaches its maximum and begins declining (first described by geologist M. King Hubbert in 1956). Today, many analysts speak of “peak oil demand” the point at which demand, rather than supply, begins to decline due to energy transition. The IEA in its NZE scenario says peak demand has already passed (2023); OPEC says demand will not peak before 2040.
Q: What is the carbon footprint of oil vs natural gas?
Combustion of one barrel of crude oil emits approximately 0.43 tonnes of CO2. Natural gas emits approximately 50 kg CO2 per gigajoule of energy, compared to about 95 kg for coal. However, upstream methane leakage significantly affects the real-world climate impact of natural gas.
Q: What is the difference between bbl and Mcf?
“bbl” stands for barrel 42 US gallons or approximately 159 liters the standard unit for crude oil. “Mcf” stands for thousand cubic feet, a common US unit for natural gas volume. One barrel of oil equivalent (BOE) is roughly equal to 6 Mcf of gas in energy terms.
Q: What is a refinery?
A refinery is an industrial facility that processes crude oil into useful petroleum products through distillation, cracking, treating, and blending processes. Global refining capacity is approximately 100 mb/d.
Q: What is the Strait of Hormuz and why does it matter?
The Strait of Hormuz is a narrow waterway between Iran and the Arabian Peninsula through which approximately 21 mb/d of oil flows about 20 percent of global oil trade. Any disruption to this chokepoint would immediately affect global oil supplies and prices.
Q: What is LNG and how is it transported?
LNG (Liquefied Natural Gas) is natural gas cooled to -162 degrees C until it liquefies, reducing its volume 600-fold. It is transported in insulated cryogenic tankers (LNG carriers) and regasified at import terminals before entering pipeline networks.
Q: What is OPEC and how does it affect oil prices?
OPEC (Organization of the Petroleum Exporting Countries) is a cartel of 11 major oil-exporting nations that coordinates production to manage oil prices. Together with OPEC+ (which includes Russia and other producers), it controls over 55% of global production. OPEC production decisions are a major driver of global oil price movements.
Q: What is fracking?
Hydraulic fracturing (fracking) is a well stimulation technique that injects high-pressure fluid into shale rock to create fractures, releasing trapped oil and gas. The US shale revolution, based on fracking, made the US the world’s largest oil and gas producer.
Q: What is the difference between conventional and unconventional oil and gas?
Conventional oil and gas flows naturally from porous reservoirs to wells. Unconventional resources (shale oil, shale gas, oil sands, tight gas) require special technology hydraulic fracturing, horizontal drilling, or steam injection to extract.
Q: How does an oil spill affect the environment?
Oil spills kill birds and marine mammals through coating and ingestion, create oxygen depletion in water, contaminate shellfish beds, and leave persistent toxic compounds in sediments. Recovery times range from years (coastal spills) to decades (fragile ecosystems like mangroves and seabed communities).
Q: What is a blowout?
A blowout is an uncontrolled release of oil and gas from a well when pressure barriers fail. Prevention relies on drilling fluid (mud) pressure, wellbore barriers (cement and casing), and the blowout preventer (BOP). The Deepwater Horizon blowout in 2010 is the most famous modern example.
Q: What is natural gas used for besides electricity generation?
Natural gas is used for residential heating and cooking, industrial process heat, chemical and fertilizer production (via ammonia synthesis), CNG vehicles, LNG export, and direct reduction of iron ore in steel making. About 40 percent of natural gas is used in industry, 22 percent in residential and commercial buildings, and 36 percent in power generation (IEA 2022).
Q: What is the role of NOCs vs IOCs?
National Oil Companies (NOCs) like Saudi Aramco, ADNOC, and Petrobras are state-owned and control the majority of global reserves. International Oil Companies (IOCs) like ExxonMobil, Shell, and BP are publicly listed, globally operating companies. NOCs have strategic and social objectives alongside commercial ones; IOCs focus on shareholder returns.
Q: How is oil shipped from producing countries to consumers?
The majority of crude oil is shipped by tankers (VLCC, Suezmax, Aframax classes) across the oceans. Some is transported by pipeline (trans-border pipelines). Crude oil must then be refined before use. Petroleum products (gasoline, diesel, jet fuel) move by products tanker, pipeline, rail, and truck.
Q: What is the difference between upstream, midstream, and downstream?
Upstream covers exploration and production (finding and extracting oil and gas). Midstream covers transportation, storage, and processing (pipelines, LNG terminals, gas plants). Downstream covers refining and marketing of products (refineries, petrol stations, chemical plants).
Q: What is a production sharing contract?
A Production Sharing Contract (PSC) is an agreement between a government and an oil company under which the company bears all exploration and development costs and recovers them from produced oil (“cost oil”) before sharing remaining production (“profit oil”) with the government in agreed proportions.
Q: What is peak demand for oil?
Peak demand is the point at which global oil consumption reaches its maximum before beginning a sustained decline. This would be driven by energy efficiency improvements, EV adoption, renewable energy growth, and demand-side policy. The IEA says demand may have peaked around 2023-2025 in aggressive transition scenarios; OPEC and many industry analysts expect demand to keep growing until at least the 2030s.
Q: What are Scope 1, 2, and 3 emissions in oil and gas?
Scope 1 emissions are direct emissions from a company’s own operations (flaring, combustion, venting). Scope 2 are indirect emissions from purchased electricity. Scope 3 are all other indirect emissions including the combustion of sold oil and gas products by customers. Scope 3 represents 85-90% of a typical oil and gas company’s total emissions footprint.
Q: What is a carbon price and how does it affect oil and gas?
A carbon price (carbon tax or emissions trading scheme cap) puts a cost on CO2 emissions, making fossil fuels more expensive relative to low-carbon alternatives and incentivizing efficiency and clean energy investment. The EU ETS carbon price reached over 90 euros per tonne in 2023. A sufficiently high carbon price would make high-carbon oil and gas reserves uneconomical.
Q: What is hydrogen’s role in the future of oil and gas?
Currently, most hydrogen is “grey hydrogen” produced from natural gas via steam methane reforming (SMR), emitting CO2. “Blue hydrogen” adds carbon capture to SMR. “Green hydrogen” uses renewable electricity to split water via electrolysis. Oil and gas companies are investing in both blue and green hydrogen as potential low-carbon products, and hydrogen could play a role in decarbonizing heat, industry, and heavy transport.
Q: What is the Permian Basin?
The Permian Basin in West Texas and New Mexico is the most productive oil-producing region in the US and the world. It produces over 6 million barrels per day of crude oil from stacked shale formations (Wolfcamp, Spraberry, Bone Spring) using horizontal drilling and hydraulic fracturing. ExxonMobil, Chevron, ConocoPhillips, and Pioneer (acquired by ExxonMobil in 2024) are major Permian producers.
Q: What is a FPSO?
A Floating Production, Storage, and Offloading (FPSO) vessel is a type of offshore oil and gas facility that processes produced oil and gas, stores crude oil in its hull, and offloads it periodically to shuttle tankers. FPSOs can operate in virtually any water depth and do not require a pipeline to shore, making them the preferred solution for remote deepwater developments.
Q: What was the Deepwater Horizon disaster?
The Deepwater Horizon was a deepwater drilling rig that exploded and sank in the Gulf of Mexico on April 20, 2010, killing 11 workers. The blowout at the Macondo well flowed for 87 days, releasing approximately 4.9 million barrels of oil the largest accidental marine oil spill in history. BP paid over $65 billion in fines, cleanup costs, and legal settlements. The disaster triggered major reforms in offshore drilling safety regulation.
Q: What is the difference between oil price and gas price?
Oil is priced globally (Brent, WTI) and is highly interconnected due to the global tanker market. Natural gas prices are more regional because gas is harder to transport pipeline gas is priced regionally (Henry Hub in the US, TTF in Europe, JKM in Asia), while LNG is creating more global price linkage but at higher cost and with slower arbitrage than oil.
Q: What is methane and why does it matter for climate?
Methane (CH4) is the primary component of natural gas. It is a potent greenhouse gas approximately 84 times more warming than CO2 over 20 years. Leaks of methane from oil and gas operations (“fugitive emissions”) are a major climate concern, undermining the climate benefit of switching from coal to gas.
Q: What is enhanced oil recovery (EOR)?
EOR refers to techniques used to extract more oil from reservoirs than is possible through natural pressure or simple water injection. Methods include CO2 flooding, steam injection (for heavy oil), polymer flooding, and surfactant flooding. EOR can increase recovery from an average of 30-40% of OOIP to 40-60% or higher.
Q: What is the future of oil demand in developing nations?
Developing nations in Asia, Africa, and Latin America are projected to drive most future oil demand growth. As per capita incomes rise, vehicle ownership, air travel, and industrial activity grow. India is projected to be the largest source of oil demand growth through 2040 (IEA). Many developing countries argue that restricting their access to oil revenue and demand is inequitable given that developed countries grew wealthy on fossil fuels.
Q: How does the oil price affect everyday consumers?
Higher oil prices feed through to consumer prices through gasoline and diesel (directly visible at the pump), heating oil, airline tickets (jet fuel), food prices (through fertilizer and transport costs), and the prices of any manufactured goods that use petroleum-based plastics or require energy to produce. A $10 per barrel increase in oil prices typically raises US retail gasoline prices by approximately 24 cents per gallon.
This guide is regularly updated to reflect the latest data and developments in the global oil and gas industry. For the most current market data, consult the IEA Oil Market Report, OPEC Monthly Oil Market Report, EIA Short-Term Energy Outlook, and BP Statistical Review of World Energy.
37. Conclusion: Oil and Gas in a World in Transition
Few industries carry as much weight economic, political, environmental, and human as oil and gas. In the span of just 165 years, from Drake’s modest 25-barrel-per-day well in Pennsylvania to Saudi Aramco’s 12-million-barrel-per-day operation, petroleum has powered the most rapid expansion of human prosperity in history. It built cities, fed billions through nitrogen fertilizers, connected the world through aviation, and underpinned virtually every product of modern manufacturing.
That legacy is also, however, a burden. The same carbon that powered industrial civilization is now disrupting the climate systems on which all life depends. The same wealth that lifted nations has, in many cases, created dependency, corruption, and conflict. The oil and gas industry enters the mid-2020s at one of the most consequential crossroads in its history.
What Is Certain
Some things are clear. Global oil demand at approximately 102 million barrels per day in 2024 will not collapse overnight. The energy system is vast, capital-intensive, and deeply embedded in infrastructure that takes decades to replace. Billions of people in developing nations are only beginning to access the mobility, cooking energy, and manufactured goods that petroleum makes possible. For them, an abrupt end to oil and gas is not an energy transition it is an energy denial.
Natural gas, for its part, is likely to remain a critical fuel for decades, particularly in Asia, where it displaces coal in power generation and provides feedstock for the fertilizers that feed hundreds of millions. The global LNG trade, now exceeding 400 million tonnes per year, reflects a world that still deeply depends on gas and is willing to pay significant sums to secure it.
What Is Changing
At the same time, the direction of travel is unmistakable. Electric vehicles sold 14 million units in 2023 18 percent of global new car sales and the trajectory is steeply upward. The cost of solar and wind power has fallen more than 90 percent in a decade, making them the cheapest source of new electricity generation in most of the world. Carbon pricing, fuel efficiency standards, building codes, and industrial decarbonization policies are tightening across major economies.
Peak oil demand not peak oil supply is now the central question. The debate is not whether demand will eventually decline, but when and how fast. The IEA places the peak before 2030 in aggressive transition scenarios. OPEC and most industry analysts place it in the 2040s. The truth will depend on policy choices, technology breakthroughs, and economic development trajectories that are genuinely uncertain.
What the Industry Must Do
The oil and gas industry has survived many cycles of crisis and adaptation the Standard Oil breakup, the OPEC price shocks, the shale revolution, the COVID collapse. Its engineering capability, financial resources, and operational expertise are formidable assets that can, if directed purposefully, contribute to the energy transition rather than resist it.
Reducing methane leakage responsible for a disproportionate share of near-term warming is the most immediate and cost-effective action available, and much of it is profitable with current gas prices. Carbon capture and storage, where geological conditions permit, offers a path to decarbonize hard-to-abate industrial processes. Low-carbon hydrogen, produced from natural gas with CCS or from renewables, could become a major new business for companies with existing gas infrastructure and expertise.
At the same time, the industry must be honest about stranded asset risk. Capital committed today to high-cost, high-carbon projects deep Arctic fields, oil sands expansions, complex ultra-heavy crudes may not recover its investment if the energy transition accelerates. Capital allocation discipline, already sharpened by the 2014-2020 price cycles, must also account for demand uncertainty.
A Note on Energy Justice
No honest conclusion to a guide on oil and gas can ignore the dimension of energy justice. The countries most vulnerable to climate change small island nations, sub-Saharan Africa, South Asia contributed the least to global emissions. The countries whose economies depend most on oil revenues Nigeria, Angola, Iraq, Venezuela face the most difficult transition. And the billions of people who still cook with kerosene, charcoal, or biomass need access to clean, affordable energy whether that is LPG as a bridge, natural gas, or renewable electricity.
Energy transition cannot mean that wealthy nations who grew rich on fossil fuels pull up the ladder behind them. A just transition requires financial support, technology transfer, and realistic timelines that acknowledge the different starting points of different nations.
Final Thought
Oil and gas will remain central to the global energy system for decades. The question is not whether to engage with this industry as an engineer, investor, policymaker, or informed citizen but how to engage with it wisely. That means understanding where hydrocarbons come from, how they are produced and refined, what they cost and what they emit, and what the realistic alternatives are.
This guide has aimed to provide that foundation. The industry’s future will be written by people who understand it deeply enough to improve it and, where necessary, to move beyond it.