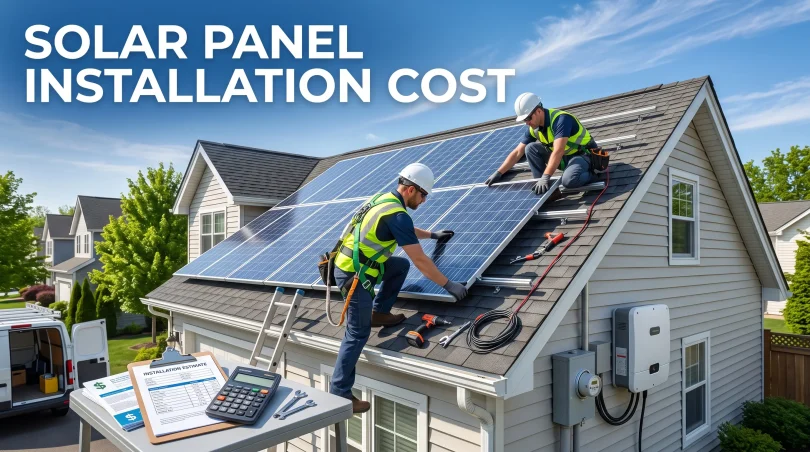

Solar panel installation costs in the U.S. generally range from $15,000 for a small 5kW system to over $35,000 for a large 12kW system. The national average sits between $2.50 and $3.50 per watt before incentives. Prices vary based on system size, state, equipment quality, and whether battery backup is included. Note that the federal residential tax credit has expired, making state and local incentives the primary way homeowners now reduce costs.
Estimated Cost by System Size
- 5 kW System: $14,000 – $18,000 (good for smaller homes, covers basic electricity needs)
- 8 kW System: $20,000 – $29,000 (most common size, covers a typical home’s usage)
- 12 kW System: $29,000 – $40,000 (handles high-consumption or larger homes)
Cost Breakdown & Factors
Payback Period: ROI timelines range from about 5 years in Washington D.C. to 14 years in Oklahoma, depending on local electricity rates and incentives.
Price per Watt: National average lands between $2.50 and $3.50 per watt installed, before any tax credit is applied.
System Size Discount: Larger systems cost less per watt since fixed costs like permitting and design are spread across more panels — a 15 kW system typically costs about $0.30 less per watt than a 5 kW system.
Battery Storage: Adding a solar battery typically increases total cost by $7,000 to $18,000.
State Variation: Costs differ significantly by state — warmer states like Arizona tend to have lower per-watt pricing, while colder states like Nebraska and South Dakota rank among the highest.
What Is Solar Panel Installation Cost?
Solar panel installation cost is the total price a homeowner or business pays to have a complete residential PV system designed, supplied, and installed on their property, including the panels, inverter, mounting hardware, wiring, permitting, and labor. This is different from the narrow “cost of solar panels,” since the panels alone typically make up only about 12 percent of total solar system cost. The rest goes to the inverter, racking, electrical work, design, permitting, and installer overhead, sometimes called soft costs.
Installers price rooftop solar using cost per watt, a simple way to compare quotes of different sizes fairly. A system quoted at $3.00 per watt for an 8,000-watt (8 kW) grid-tied solar system works out to $24,000 before any incentives. Cost per watt is the single most useful metric for comparing solar installer quotes, since it strips out the effect of system size on the total number.
Critical 2026 Update: The Federal Tax Credit Has Ended
Anyone researching solar power cost in 2026 needs to understand this policy change first, since it directly affects your final number. On July 4, 2025, the One Big Beautiful Bill Act was signed into law, eliminating the 30 percent residential solar tax credit under Section 25D for any system placed in service after December 31, 2025. There was no phase-down period. Homeowners who buy or finance a solar energy system with cash or a loan in 2026 receive zero federal tax credit on that purchase.
The one federal pathway that remains is Section 48/48E, which applies only to third-party owned systems, meaning solar leases and power purchase agreements (PPAs), where the financing company claims the 30 percent credit and can pass some savings back through the payment structure. This pathway remains available through the end of 2027. State-level incentives, utility rebates, and SREC markets still exist in many states and can meaningfully offset the loss of the federal credit, so checking your state’s current programs at a resource like the DSIRE database is a necessary step before budgeting.
National Average Solar Panel Installation Cost in 2026
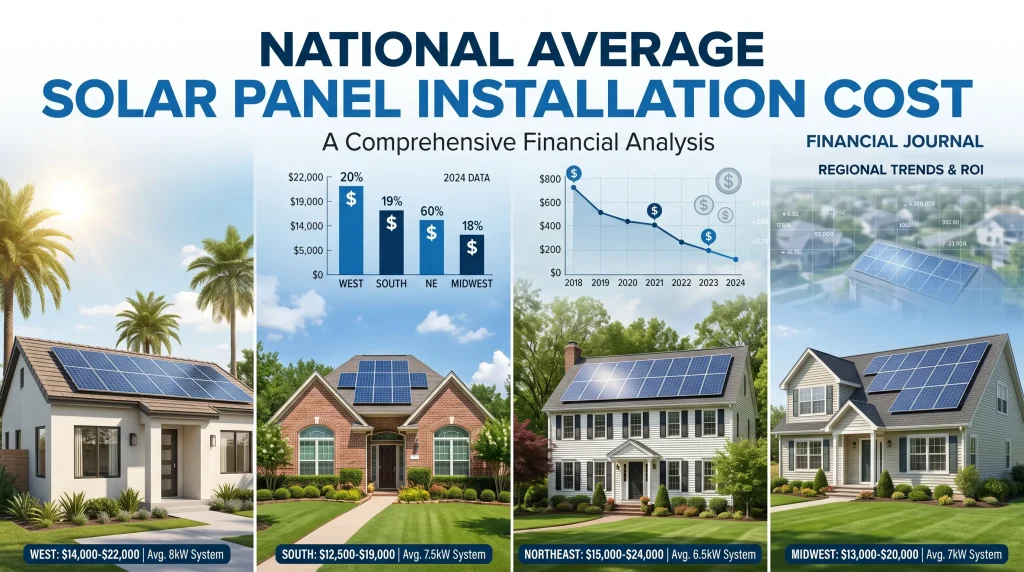
Across multiple 2026 industry sources, including SEIA data and Lawrence Berkeley National Laboratory’s Tracking the Sun report, the national average for residential PV installation cost lands between roughly $2.50 and $3.50 per watt before incentives, with most compiled averages clustering around $2.85 to $2.95 per watt. That puts a typical 7 kW home solar installation at roughly $18,000 to $25,000 before any state or utility incentive.
| System Size | Typical Household Fit | Estimated Cost Before Incentives |
|---|---|---|
| 4 to 6 kW | Small or efficient homes, partial bill offset | $12,000 to $21,000 |
| 6 to 8 kW | Most common size for average U.S. homes | $17,500 to $28,000 |
| 8 to 10 kW | Larger homes, EV charging, higher usage | $20,000 to $35,000 |
| 10 to 12 kW+ | Large homes or all-electric households | $29,000 to $40,000 |
These figures reflect gross installed pricing before any incentive and exclude battery storage, which typically adds another $8,000 to $15,000 to a hybrid solar project.
Solar Panel Installation Cost by State
Where you live changes your solar system cost significantly, driven mainly by labor rates, permitting complexity, and local installer competition rather than sunlight alone. The table below aggregates ranges reported across several 2026 industry sources; treat it as a directional guide rather than an exact quote, since city-level and installer-level pricing still varies within each state.
| State | Approx. Cost per Watt (2026) | 7 kW System Estimate | Relative Tier |
|---|---|---|---|
| California | $2.40 to $2.90 | $16,800 to $20,300 | Mid to competitive, offset by high electricity rates |
| Texas | $2.60 to $2.95 | $18,200 to $20,650 | Low to mid |
| Florida | $2.20 to $2.80 | $15,400 to $19,600 | Low |
| Arizona | $2.16 to $2.65 | $15,100 to $18,550 | Lowest |
| New York | $3.00 to $3.35 | $21,000 to $23,450 | High |
Arizona, Texas, Nevada, Florida, and New Mexico consistently rank as the lowest-cost states thanks to high installer competition and streamlined permitting, while Massachusetts, Connecticut, New York, and Rhode Island tend to rank highest due to labor rates and more complex permitting. Interestingly, several high-cost states, including California and Massachusetts, still deliver strong long-term returns because their electricity rates run well above the national average, which shortens the payback period even at a higher upfront installed cost.
Estimated Monthly and Lifetime Savings
Installation cost only tells half the story. What actually matters to most homeowners is how solar energy savings compare to the electric bill it replaces. The figures below are illustrative estimates based on typical usage patterns and average national electricity rates, not a quote for any specific home.
| System Size | Avg. Monthly Bill Before Solar | Est. Monthly Bill After Solar | Estimated Annual Savings | Estimated 25-Year Savings |
|---|---|---|---|---|
| 5 kW | $150 | $45 | $1,260 | $31,500 |
| 7 kW | $200 | $35 | $1,980 | $49,500 |
| 10 kW | $280 | $40 | $2,880 | $72,000 |
Actual savings depend heavily on your local utility rate, your net metering policy, roof orientation, and shading, so these numbers should be treated as a starting point for comparison rather than a personal estimate. A site-specific quote from a solar contractor, ideally with a production guarantee, is the only reliable way to confirm your real numbers.
ROI and Payback Period Table
Return on investment for a residential PV system is usually measured by payback period, the number of years it takes for cumulative electricity savings to equal the installation cost.
| System Size | Installed Cost (before incentives) | Estimated Annual Savings | Approx. Payback Period |
|---|---|---|---|
| 5 kW | $15,000 | $1,260 | Around 12 years |
| 7 kW | $20,000 | $1,980 | Around 10 years |
| 10 kW | $29,000 | $2,880 | Around 10 years |
Since most panels carry a 25-year production warranty, a system with a 10-year payback period can still deliver roughly 15 years of largely free electricity afterward, assuming normal panel degradation and stable utility rates. Without the federal tax credit, payback periods in 2026 run somewhat longer than they did in prior years, which makes comparing state incentives and electricity rates more important than ever.
What Drives Solar Power Cost Up or Down
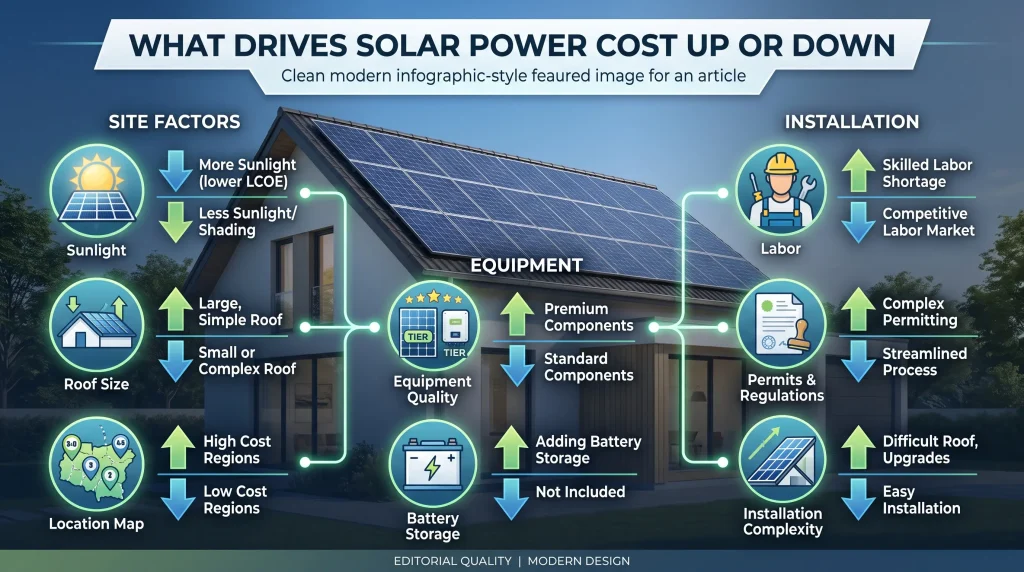
- System size: Larger systems cost more in total but usually carry a slightly lower price per watt.
- Roof type and pitch: A tile roof commonly adds $1,000 to $2,500, and a steep pitch of 8:12 or higher can add another $500 to $1,200 in labor.
- Electrical panel upgrades: If your home’s electrical panel cannot support the new solar installation, an upgrade can add $1,500 to $3,500.
- Equipment quality: Premium monocrystalline panels with microinverters can push the price toward $3.50 per watt or higher, while value-tier panels keep costs closer to $2.50 per watt.
- Location and labor rates: Labor represents roughly 15 to 25 percent of total system price and is the single largest variable cost between states.
- Battery storage: Adding a solar battery for backup power typically adds $8,000 to $15,000 depending on capacity, and shifts a grid-tied system toward a hybrid solar setup.
- Financing method: Cash, solar loan, or lease/PPA financing each produce a different true cost, covered below.
- Net metering policy: States and utilities with strong net metering pay you closer to full retail rate for excess power sent to the grid, which improves the financial case even where installed cost is higher.
Cost of Solar Panels vs Cost to Install Solar Panels
| Item | What It Covers | Typical Price |
|---|---|---|
| Cost of Solar Panels (panel only) | The physical photovoltaic panel hardware, no labor | $130 to $250 per panel (400 to 440 watt panels) |
| Installed Cost Per Panel | Panel plus labor, racking, inverter share, permits | $550 to $1,100 per panel |
| Full System Installation Cost | Complete residential PV system: panels, inverter, racking, wiring, labor, permits | $2.50 to $3.50 per watt installed |
This distinction matters because a homeowner comparing bare “solar panel cost” listings is looking at a very different number than the full solar panel installation cost quoted by a solar installer for a complete system.
Financing Options: Cash vs Loan vs Lease
| Financing Method | Upfront Cost | True Cost Per Watt | Who Owns the System | Best For |
|---|---|---|---|---|
| Cash Purchase | Full price at installation | $2.50 to $3.50 per watt | Homeowner | Maximum long-term savings, no interest |
| Solar Loan | Low or no down payment | Often closer to $3.60 per watt after dealer fees and interest | Homeowner | Buyers who want ownership without paying cash upfront |
| Lease or PPA | Little to no upfront cost | Lower monthly payment, lower total lifetime savings | Financing company | Buyers who want $0 down and remaining eligible for the Section 48 federal credit indirectly |
Solar loans often carry dealer fees that add close to 20 percent to the loan principal, and a typical 20-year loan at around 6 percent interest can mean paying substantially more over the life of the loan compared to the cash price. Cash purchases produce the cleanest comparison and the highest lifetime savings, while leases and PPAs remain attractive for buyers who cannot pay upfront and do not need to own the system outright.
Solar Panel Installation Cost vs Other Energy Options
Solar is one of several ways to reduce reliance on grid electricity or add backup power, and it is worth understanding how it compares.
Solar vs Grid Electricity: Grid electricity has no upfront cost but comes with an ongoing monthly bill that typically rises over time. A residential solar installation requires a significant upfront cost but can eliminate or drastically reduce that monthly bill over 25 or more years, making it a long-term investment rather than a pay-as-you-go utility.
Solar vs Wind: Small-scale residential wind turbines are far less common than rooftop solar in most suburban and urban areas because they require consistent, strong wind and often face stricter zoning and noise restrictions. Solar energy is generally more practical for the average homeowner because it works reliably in nearly any sunny location and does not require the same site-specific wind conditions.
Solar vs Generator: A backup generator, whether gas or propane, provides power only when running and requires ongoing fuel costs and maintenance. A grid-tied solar system with battery backup provides ongoing electricity generation and storage without a continuous fuel cost, though the upfront investment is considerably higher than a standalone generator.
Solar vs Battery: Solar panels generate electricity, while a solar battery stores it for use when the sun is not shining or during a grid outage. The two are complementary rather than competing, and a hybrid solar system that pairs panels with battery storage offers both energy generation and backup resilience, at a higher combined cost than panels alone.
Expert Insight
The single biggest mistake homeowners make when evaluating solar power cost is comparing a marketplace average price against their own quote without adjusting for financing method, according to industry analysts and installers. A $3.00 per watt cash quote and a $3.00 per watt loan quote are not the same offer, because the loan version usually carries dealer fees and interest baked into the payment schedule that push the true cost meaningfully higher. Before accepting or rejecting any quote, homeowners should ask the solar contractor to show the cash price and the financed price separately, since that single request exposes markup that a bundled monthly payment number can hide.
Common Mistakes When Estimating Solar Panel Installation Cost
- Assuming the federal 30 percent tax credit still applies: The Section 25D credit expired for cash and loan purchases at the end of 2025, so budgeting around an old 30 percent discount will produce a significantly wrong number in 2026.
- Comparing panel-only prices to full installation quotes: Confusing a $150 panel price with the full $2.50 to $3.50 per watt installed cost leads to badly underestimating the real budget.
- Not comparing cost per watt across quotes: Comparing total dollar amounts between systems of different sizes instead of normalizing to price per watt hides which quote is actually the better deal.
- Ignoring financing markup: Accepting a loan-based monthly payment without asking for the equivalent cash price, which can hide dealer fees and interest that add thousands to the total cost.
- Skipping multiple quotes: Signing with the first solar installer instead of comparing three to five quotes, which is one of the most reliable ways to catch an inflated soft-cost markup.
- Underestimating roof and electrical complexity: Failing to budget for a tile roof surcharge, steep pitch labor, or an electrical panel upgrade.
- Oversizing or undersizing the system: Choosing a system size based on roof space alone instead of actual annual kWh usage.
- Ignoring state and utility incentives: Assuming that because the federal credit is gone, no incentives remain, when state programs, SRECs, and utility rebates can still meaningfully offset cost in many states.
Before You Sign a Solar Contract: Checklist
- [ ] Annual electricity usage (kWh) calculated to size the system correctly
- [ ] At least three solar installer quotes compared using cost per watt, not total price alone
- [ ] Cash price and financed price requested separately for each quote
- [ ] State and utility incentive eligibility confirmed for 2026, since the federal residential credit is gone
- [ ] Roof type, pitch, and any electrical panel upgrade needs assessed
- [ ] Battery storage need and added cost decided in advance
- [ ] Net metering policy for your utility confirmed before signing
- [ ] Equipment tier (value vs premium panels) matched to budget and roof constraints
- [ ] Warranty length and production guarantee reviewed for each quote
- [ ] Payback period and 25-year savings estimate requested from the installer
Frequently Asked Questions
What is the average solar panel installation cost in 2026?
Most homeowners pay between $2.50 and $3.50 per watt installed in 2026, which works out to roughly $17,500 to $28,000 for a typical 6 to 8 kW residential solar installation before incentives.
Is there still a tax credit for solar power cost in 2026?
Not for cash or loan purchases. The 30 percent federal residential credit under Section 25D expired December 31, 2025. The only remaining federal incentive path applies to leases and power purchase agreements through Section 48/48E.
What is the difference between the cost of solar panels and the cost to install solar panels?
The cost of solar panels refers to the physical panel hardware alone, typically $130 to $250 per panel. The cost to install solar panels covers the complete system, including inverter, racking, wiring, permits, and labor, which is why the fully installed price per panel is closer to $550 to $1,100.
Does a solar loan cost more than paying cash?
Yes, in most cases. Solar loans commonly carry dealer fees close to 20 percent of the loan principal, plus interest, which pushes the true cost per watt higher than a cash purchase over the life of the loan.
How long does it take for solar panels to pay for themselves?
Most cash-purchased systems reach payback in roughly 8 to 12 years in 2026, somewhat longer than in years when the federal credit was still available, with panels typically carrying a 25-year production warranty.
How much does labor cost for a solar installation?
Labor typically represents 15 to 25 percent of the total installed cost, and is one of the biggest reasons the same system can cost thousands more in a high-labor-cost state than in a low-cost one.
How many solar panels do I need for my home?
Most homes need between 18 and 34 panels, depending on annual electricity usage, panel wattage, and available roof space, with the average U.S. residential system landing between 6 kW and 10 kW.
Can I install solar panels myself?
DIY solar kits exist and typically cost $0.80 to $1.40 per watt for equipment only, but they exclude professional installation, permitting, and utility interconnection, and most utilities require a licensed installer to approve grid-tied systems for net metering.
How much does adding a solar battery cost?
A solar battery for backup power typically adds $8,000 to $15,000 to a project, depending on capacity, and converts a standard grid-tied system into a hybrid solar setup with outage protection.
Does the age of my roof matter for solar installation?
Yes. Most installers recommend that a roof have at least 15 to 20 years of remaining life before adding solar, since removing and reinstalling panels to repair or replace an aging roof later adds significant extra cost.
How long does a solar installation take?
Physical installation on an average home typically takes one to three days, though the full process, including design, permitting, and utility interconnection approval, often takes several weeks to a few months from contract to activation.
Will solar panels increase my home value?
Multiple industry studies indicate that owned solar systems can increase home resale value, though the effect is generally smaller for leased systems, since a lease or PPA transfers to the new owner rather than adding owned equity.
Can solar panels eliminate my electric bill completely?
A correctly sized grid-tied system can offset most or nearly all of your annual electricity usage, but most homes still receive a small utility bill for grid connection fees, and true bill elimination usually requires pairing solar with battery storage and going off-grid solar, which is uncommon for typical residential setups.
Sources and References
- Lawrence Berkeley National Laboratory, Tracking the Sun report
- National Renewable Energy Laboratory (NREL)
- Solar Energy Industries Association (SEIA)
- EnergySage residential solar marketplace data
- U.S. Department of Energy, Solar Energy Technologies Office
- DSIRE database of state and utility incentives
Final Thoughts
Solar panel installation cost in 2026 depends on far more than the price tag on a panel. System size, roof complexity, equipment tier, your state, and especially your financing method all combine to determine the real number you will pay, and the expiration of the federal tax credit for cash and loan purchases makes accurate 2026 budgeting more important than ever. Whether you are comparing install solar panels cost estimates, researching general solar power cost, or trying to understand the true cost of solar panels versus a full residential PV installation, get at least three quotes, compare them by cost per watt, check your state’s incentives, and confirm exactly which programs still apply to your purchase before you sign.
You May Also Like It:
Power Outage Safety Guide: How to Prepare for Outages and Emergencies
Power to Choose in Texas: The Complete Guide to Comparing Electricity Plans
CenterPoint Outage Map Houston: How to Report and Track Power Outages
Consumers Outage Map: Complete Guide to Tracking Power Outages in Michigan